


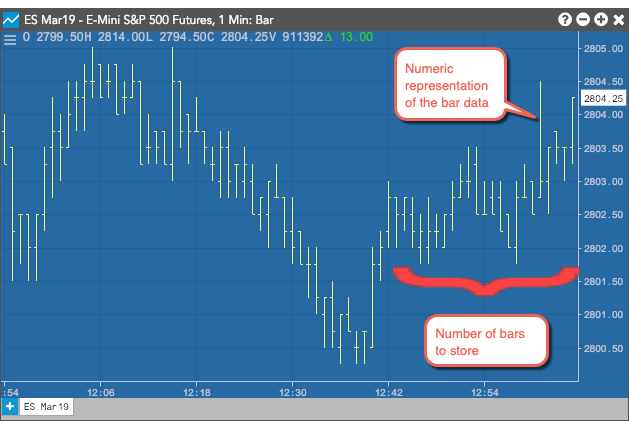
The Analytics block generates bar data for an instrument. The Analytics block creates a numeric representation of a standard bar chart, similar to the following. You define the duration of a bar and how many rolling bars of data you want the block to store. As each new bar is added, the oldest bar is dropped.
Note: you cannot use more than five Analytics blocks in a single algo.
Supported Environments
The Analytics block functionality is only supported in the Production-Live and Production-Simulation environments.
Note: The analytics block cannot be used in the Production-Delayed and the UAT environments.
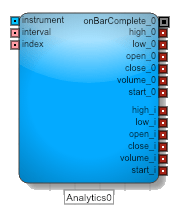
Input and output ports
The Analytics block requires three inputs:
- The instrument port identifies the instrument whose data you want to collect.
- The interval port defines how to aggregate data into bars. Valid values:
- Time (minutes) — Sets the length of time in minutes to aggregate data. Supported values: 1-1440.
- Volume — Sets the amount of trading volume used to aggregate data. Supported values: 50 – 999,999.
- The index port indicates which bar’s data to send through the value_i output ports. The Analytics block collects and stores an array with the number of bars defined in the Number of Bars to show/store setting in the Block Properties panel. The index value specifies the index into that array.
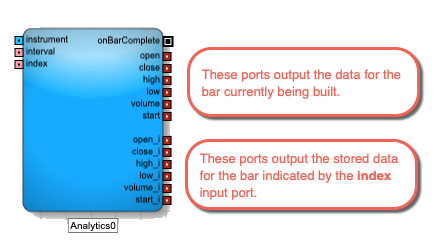
The Analytics Block ouputs values for the current bar and the bar at the specified index in the array. The available fields are:
- open: Price at the start of the interval
- close: Price at the end of the interval
- high: Highest traded price during the interval
- low: Lowest traded price during the interval
- volume: Total volume traded during the interval
- start: Timestamp for the start of the interval
- onBarChange: Fired when the bar changes after it closes. This can happen, for example, when a trade occurs very close to a bar close and arrives after the bar has closed.
How the Analytics block stores bar data
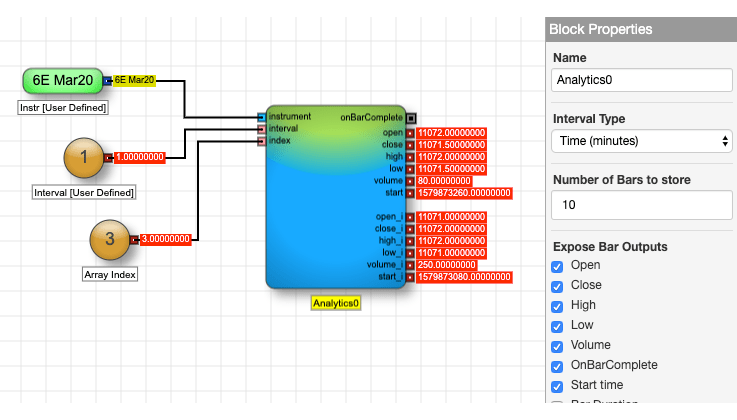
When adding an Analytics block, you specify the Number of Bars to show/store setting in the Block Properties panel. This value represents the size of the array the block uses to store its historical bar data. When you start an algo, the block’s array is loaded with historical data. After a trade occurs for the block’s associated instrument, the block begins outputting values through its current bar output ports (open, close, etc.).
At the end of the first interval, the block stores the first interval’s values to array index 1 (open_1, close_1, etc.). When the next interval completes, the values in array index 1 are copied to array index 2 (open_2, close_2, etc.) and the values of the current bar are stored in array index 1. This process continues until the array is filled. Once the maximum number of stored bars is reached, the block drops the oldest bar and shifts the array down to make room for the next bar’s data.
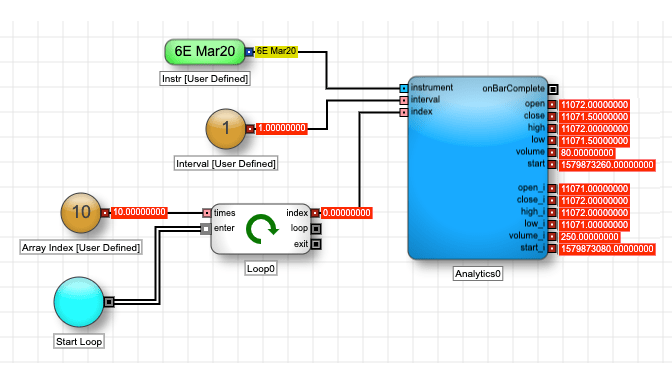
Example: Time: The Analytics block contains the data for the 10 most recent 1-minute bars for the CME 6E Mar20 contract. It displays the values for the current bar and the third most recent bar.
You can iterate over the contents of an Analytics block and output each bar by changing the input of the index port, for example, using a Loop block.
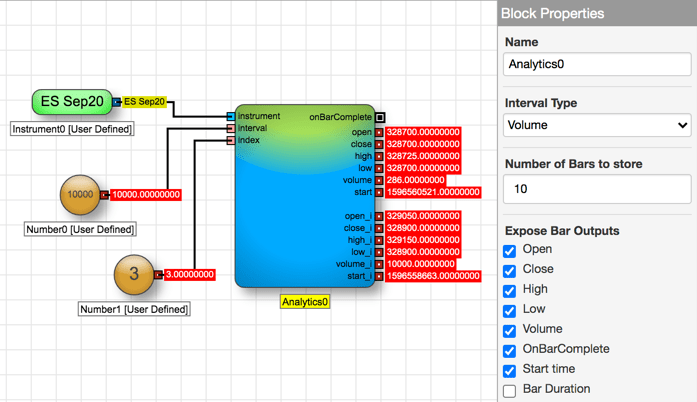
Example: Volume: The Analytics block contains the data for the 10 most recent bars for every 10,000 CME ES SEP20 contracts traded. It displays the values for the current bar and the third most recent bar.
Using technical indicators
The Analytics block also supports several technical indicators to provide additional analysis using the data held by the block. Each technical indicator uses a unique mathematical formula to analyze the data to provide a particular view into the block’s data.
- Average True Range
- Bollinger Bands
- MACD
- Simple Moving Average
- Exponential Moving Average
- Double Exponential Moving Average
- Triple Exponential Moving Average
- Weighted Moving Average
- Relative Strength Indicator
- Standard Deviation
- Stochastic Oscillator
For more information about these indicators, see Technical indicators article in the Charts section of the Trade application help
Average True Range
The Average True Range (ATR) indicator measures the size of the period’s range and takes into account any gap from the close of the previous period.
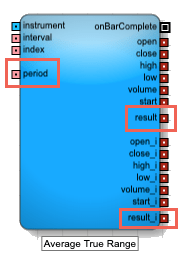
This indicator adds the following to the Analytics block:
- Input ports
period: Number of bars to use in the calculations
Note: All period parameters (i.e., period, fastK_Period, fastPeriod, slowPeriod, signalPeriod, slowK_Period, and slowD_Period) accept a minimum value of 2 and a maximum value of 250.
- result, result_i: The calculated Average True Range
For detailed informationabout this technical indicator, see Average True Range in the Charts section of the Trade application help.
Bollinger Bands
The Bollinger Bands indicator determines the upper and lower envelope bands around the price of the instrument. The width of the bands is based on the standard deviation from a moving average of price.
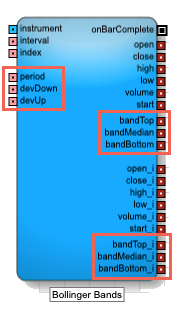
This indicator adds the following to the Analytics block:
- Input ports
period: Number of bars to use in the calculations
Note: All period parameters (i.e., period, fastK_Period, fastPeriod, slowPeriod, signalPeriod, slowK_Period, and slowD_Period) accept a minimum value of 2 and a maximum value of 250.
- devDown: Number of standard deviations below the average
- devUp: Number of standard deviations above the average
- bandTop, bandTop_i: Moving average plus the specified standard deviation
- bandMedian, bandMedian_i: Moving average of the specified number of periods
- bandBottom, bandBottom_i: Moving average minus the specified standard deviation
- Field: Price or combination of prices to use as the base for average calculations
- Open
- High
- Low
- Close
- Adjusted Close
- HighLow/2 : (High + Low) / 2
- HighLowClose/3 : [High + Low + Close) / 3
- HighLowCloseClose/4 : (High + Low + Close + Close) / 4
- OpenHighLowClose/4 : (Open + High + Low + Close) / 4
- Moving Average Type: Type of moving average to use in the calculation
- Simple
- Exponential
- Double Exponential
- Triple Exponential
- Weighted
For detailed information about this indicator, see Bollinger Bands (BBANDS) in the Charts section of the Trade application help.
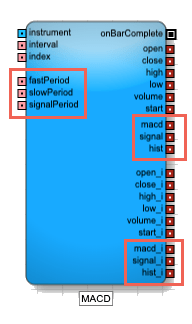
MACD
The Moving Average Convergence Divergence (MACD) indicator is based on the differences between two moving averages, a Fast and a Slow moving average.
This indicator adds the following to the Analytics block:
- Input ports
-
fastPeriod: Number of periods to use in the fast moving average
-
slowPeriod: Number of periods to use in the slow moving average
-
signalPeriod: Number of periods in the signal calculation
Note: All period parameters (i.e., period, fastK_Period, fastPeriod, slowPeriod, signalPeriod, slowK_Period, and slowD_Period) accept a minimum value of 2 and a maximum value of 250.
-
- Output ports
- macd, macd_i: Difference between the fast and slow moving averages
- signal, signal_i: Moving Average of the macd
- hist, hist_i: MACD histogram, which is difference between macd and signal
- Block properties
- Field: Price or combination of prices to use as the base for average calculations
- Open
- High
- Low
- Close
- Adjusted Close
- HighLow/2 : (High + Low) / 2
- HighLowClose/3 : [High + Low + Close) / 3
- HighLowCloseClose/4 : (High + Low + Close + Close) / 4
- OpenHighLowClose/4 : (Open + High + Low + Close) / 4
- Field: Price or combination of prices to use as the base for average calculations
For detailed information about this indicator, see Average in the Charts section of the Trade application help.
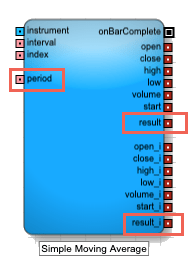
Simple Moving Average
The Simple Moving Average indicator helps determine whether an instrument’s price trend is increasing or decreasing. It calculates a moving average for a most-recent specified number of bars by adding the prices of the selected field for each bar and dividing the sum by the number of periods.
This indicator adds the following to the Analytics block:
- Input ports
period: Number of bars to use in the calculations
Note: All period parameters (i.e., period, fastK_Period, fastPeriod, slowPeriod, signalPeriod, slowK_Period, and slowD_Period) accept a minimum value of 2 and a maximum value of 250.
- result, result_i: Result of the formula calculations
- Field: Price or combination of prices to use as the base for average calculations
- Open
- High
- Low
- Close
- Adjusted Close
- HighLow/2 : (High + Low) / 2
- HighLowClose/3 : [High + Low + Close) / 3
- HighLowCloseClose/4 : (High + Low + Close + Close) / 4
- OpenHighLowClose/4 : (Open + High + Low + Close) / 4
For detailed information about this indicator, see Moving Average in the Charts section of the Trade application help.
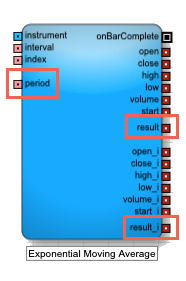
Exponential Moving Average
The Exponential Moving Average indicator is similar to the Simple Moving Average indicator, but it places greater signficance on the most recent periods when calculating the price trend. The weights of older bars descrease exponentially.
This indicator adds the following to the Analytics block:
- Input ports
period: Number of bars to use in the calculations
Note: All period parameters (i.e., period, fastK_Period, fastPeriod, slowPeriod, signalPeriod, slowK_Period, and slowD_Period) accept a minimum value of 2 and a maximum value of 250.
- result, result_i: Result of the formula calculations for the two bars
- Field: Price or combination of prices to use as the base for average calculations
- Open
- High
- Low
- Close
- Adjusted Close
- HighLow/2 : (High + Low) / 2
- HighLowClose/3 : [High + Low + Close) / 3
- HighLowCloseClose/4 : (High + Low + Close + Close) / 4
- OpenHighLowClose/4 : (Open + High + Low + Close) / 4
For detailed information about this indicator, see Moving Average in the Charts section of the Trade application help.
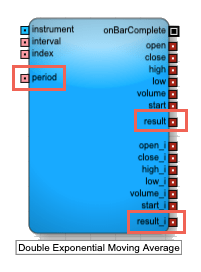
Double Exponential Moving Average
The Double Exponential Moving Average indicator is similar to the Exponential Moving Average indicator, but it places greater signficance on the most recent periods when calculating the price trend.
This indicator adds the following to the Analytics block:
- Input ports
period: Number of bars to use in the calculations
Note: All period parameters (i.e., period, fastK_Period, fastPeriod, slowPeriod, signalPeriod, slowK_Period, and slowD_Period) accept a minimum value of 2 and a maximum value of 250.
- result, result_i: Result of the formula calculations
- Field: Price or combination of prices to use as the base for average calculations
- Open
- High
- Low
- Close
- Adjusted Close
- HighLow/2 : (High + Low) / 2
- HighLowClose/3 : [High + Low + Close) / 3
- HighLowCloseClose/4 : (High + Low + Close + Close) / 4
- OpenHighLowClose/4 : (Open + High + Low + Close) / 4
For detailed information about this indicator, see Moving Average in the Charts section of the Trade application help.
Triple Exponential Moving Average
The Triple Exponential Moving Average indicator is similar to the Exponential Moving Average indicator, but it places greater significance on the most recent periods when calculating the price trend.
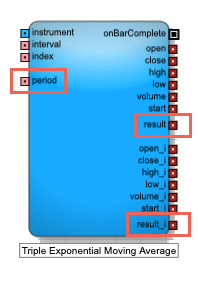
This indicator adds the following to the Analytics block:
- Input ports
period: Number of bars to use in the calculations
Note: All period parameters (i.e., period, fastK_Period, fastPeriod, slowPeriod, signalPeriod, slowK_Period, and slowD_Period) accept a minimum value of 2 and a maximum value of 250.
- result, result_i: Result of the formula calculations
- Field: Price or combination of prices to use as the base for average calculations
- Open
- High
- Low
- Close
- Adjusted Close
- HighLow/2 : (High + Low) / 2
- HighLowClose/3 : [High + Low + Close) / 3
- HighLowCloseClose/4 : (High + Low + Close + Close) / 4
- OpenHighLowClose/4 : (Open + High + Low + Close) / 4
For detailed information about this indicator, see Moving Average in the Charts section of the Trade application help.
Weighted Moving Average
The Weighted Moving Average indicator analyzes an instrument’s price trend by weighting the band values in older bars in with a decreasing arithmetic progression, as opposed to an exponential progression.
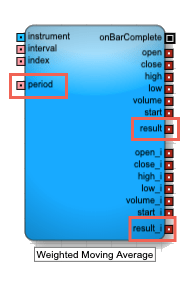
This indicator adds the following to the Analytics block:
- Input ports
period: Number of bars to use in the calculations
Note: All period parameters (i.e., period, fastK_Period, fastPeriod, slowPeriod, signalPeriod, slowK_Period, and slowD_Period) accept a minimum value of 2 and a maximum value of 250.
- result, result_i: Result of the formula calculation
- Field: Price or combination of prices to use as the base for average calculations
- Open
- High
- Low
- Close
- Adjusted Close
- HighLow/2 : (High + Low) / 2
- HighLowClose/3 : [High + Low + Close) / 3
- HighLowCloseClose/4 : (High + Low + Close + Close) / 4
- OpenHighLowClose/4 : (Open + High + Low + Close) / 4
For detailed information about this indicator, see Moving Average in the Charts section of the Trade application help.
Relative Strength Indicator
The Relative Strength Index (RSI) is used to measure underlying strength of a market move. RSI uses the prior bar’s close to current bar’s close change. RSI is an oscillator that ranges from 0 (oversold) to 100 (undersold).
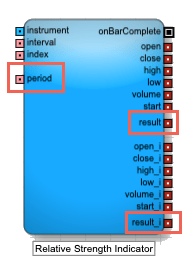
This indicator adds the following to the Analytics block:
- Input ports
period: Number of bars to use in the calculations
Note: All period parameters (i.e., period, fastK_Period, fastPeriod, slowPeriod, signalPeriod, slowK_Period, and slowD_Period) accept a minimum value of 2 and a maximum value of 250.
- result, result_i: Result of the formula calculations
- Field: Price or combination of prices to use as the base for average calculations
- Open
- High
- Low
- Close
- Adjusted Close
- HighLow/2 : (High + Low) / 2
- HighLowClose/3 : [High + Low + Close) / 3
- HighLowCloseClose/4 : (High + Low + Close + Close) / 4
- OpenHighLowClose/4 : (Open + High + Low + Close) / 4
For detailed information about this indicator, see RSI in the Charts section of the Trade application help.
Standard Deviation
The Standard Deviation indicator is a statistical calculation used to measure the variability. In trading this value is known as volatility. A low standard deviation indicates that the data points tend to be very close to the average, whereas high standard deviation indicates that the data points are spread out over a large range of values.
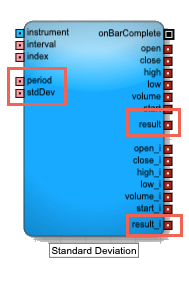
This indicator adds the following to the Analytics block:
- Input ports
period: Number of bars to use in the calculations
Note: All period parameters (i.e., period, fastK_Period, fastPeriod, slowPeriod, signalPeriod, slowK_Period, and slowD_Period) accept a minimum value of 2 and a maximum value of 250.
- stdDev: Number of standard deviations away from the average
- result, result_i: Result of the formula calculations
- Field: Price or combination of prices to use as the base for average calculations
- Open
- High
- Low
- Close
- Adjusted Close
- HighLow/2 : (High + Low) / 2
- HighLowClose/3 : [High + Low + Close) / 3
- HighLowCloseClose/4 : (High + Low + Close + Close) / 4
- OpenHighLowClose/4 : (Open + High + Low + Close) / 4
For detailed information about this indicator, see Standard Deviation in the Charts section of the Trade application help.
Stochastic Oscillator
The stochastic oscillator is a momentum indicator that compares the current closing price of an instrument to a range of its prices over a period of time. The sensitivity of the oscillator to market movements can be reduced by adjusting that time period or by taking a moving average of the result. It is generally used to generate overbought and oversold signals.
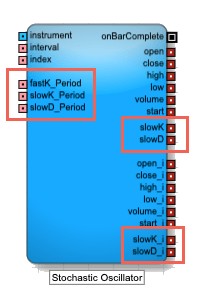
This indicator adds the following to the Analytics block:
- Input ports
-
fastK_Period: Number of bars to use when calculating the current value of the indicator (called %K)
-
slowK_Period: Number of bars to use when smoothing the fast %K values
-
slowD_Period: Number of bars to use when smoothing the slow %K values
Note: All period parameters (i.e., period, fastK_Period, fastPeriod, slowPeriod, signalPeriod, slowK_Period, and slowD_Period) accept a minimum value of 2 and a maximum value of 250.
-
- Output ports
- slowK, slowK_i: Smoothed moving average of %K
- slowD, slowD_i: Smoothed moving average of %D
- Block properties
- Slow-K Moving Average Type: Type of formula to use for smoothing the slow K moving average (sometimes called %K)
- Simple
- Exponential
- Double Exponential
- Triple Exponential
- Weighted
- Slow-D Moving Average Type: Type of formula to use for smoothing the fast K moving average (sometimes called %D)
- Simple
- Exponential
- Double Exponential
- Triple Exponential
- Weighted
- Slow-K Moving Average Type: Type of formula to use for smoothing the slow K moving average (sometimes called %K)
For detailed information about this indicator, see Stochastic Oscillator ( STOCH) in the Charts section of the Trade application help.
Block properties
To customize the block, update the Block Properties.
| Property | Description |
|---|---|
| Name | Name to display beneath the block on the ADL canvas |
| Number of Bars to show/store | Number of bars to track. The block outputs the most-recent number of bars. As a new bar is added the oldest bar is dropped. Maximum: 250 |
| Expose Bar Outputs | Output ports to display for each bar period. Valid values include:
|
| Indicator | Technical indicator to use in the Analytics block. For more information about these indicators, see Technical indicators. |