


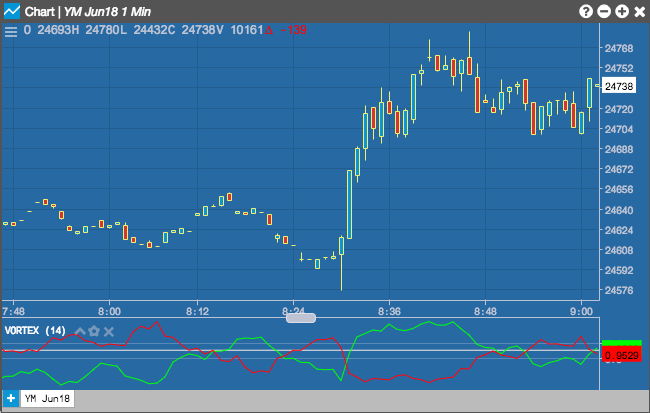
The Vortex Indicator consists of two oscillators (VI+ and VI-) used for identifying the start and direction of a market trend. When the VI+ and VI- cross, it generally indicates a market trend. The trend is up when VI+ stays above VI-, and the market trend is down when VI- crosses below VI+.
Configuration Options

- Period: Number of bars to use in the calculations.
- Color Selectors: Colors to use for graph elements.
- Over Zones Enabled: Whether to shade the area between the plot and the horizontal overbought and oversold levels.
- Over Bought: Overbought quantity
- Over Sold: Oversold quantity
- Display Axis Label: Whether to display the most recent value on the Y axis.
Formula
The calculation for the indicator is divided into three parts:
- Uptrend and downtrend movement:
- \( VM+ = {Current High} – {Prior Low} \)
- \( VM- = CurrentLow – PriorHigh \)
- \(\sum_{n=1}^{x} VM +\)
- \( \sum_{n=1}^{x} {VM\verb “-“} \)
Where “x” is the number of price bars or periods the indicator will look at (between 14 and 30 is common).
2. True Range (TR) is the greatest of:
- \( CurrentHigh – CurrentLow \)
- \( \left | CurrentHigh – PrevioiusClose \right | \)
- \( \left | CurrentHigh – CurrentLow \right | \)
- \( \left | CurrentHigh – CurrentLow \right | \)
3. Normalize uptrend downtrend movement:
- \( VIx+ = \frac{VMx+}{TRx} \)
- \( VIx- = \frac{VMx-}{TRx} \)