Trade
Overview
TT Platform
Description
Task
Browser Access
Description
Task
Videos
TT Desktop
Description
Task
Videos
Reference
Workspace Windows
Description
Task
Videos
Widgets
Description
Task
Preferences
Description
Viewing Market Data
Time and Sales
Task
Reference
Description
Depth
Description
Task
Reference
Market Grid
Description
Task
Videos
Reference
Product Grid
Description
Task
Reference
Spread Matrix
Description
Task
Videos
Reference
Basic Order Entry
TT Order Types
Description
Task
Videos
Reference
Case Studies
TT Premium Order Types
Description
Task
Reference
Order Ticket
Description
Task
Use Cases
Reference
MD Trader®
Description
Task
Videos
Reference
Order Profiles
Description
Task
Reference
Routing Rules
Description
Task
Blocktrader
Description
Task
Videos
Reference
Trading Crypto on TT
Description
Task
Videos
Reference
Trading on B3
Order Management
Order Book
Description
Task
Reference
Floating Order Book
Description
Task
Reference
Fills
Description
Task
Reference
Positions
Description
Task
Reference
Orders and Fills
Description
Task
Reference
Audit Trail
Description
Task
Reference
Audit Query
Description
Task
Reference
Account List
Description
Task
Videos
Reference
Position Manager
Description
Task
Reference
Alert Manager and Alert Viewer
Description
Task
Videos
Reference
Account & User Restrictions
Description
Task
Reference
Balances
Description
Task
Reference
TT® OMS
Care Orders
Description
Task
Videos
Reference
Lock and Release
Description
Task
Bulking
Description
Task
Videos
Stitching and Splitting
Description
Task
Combining
Description
Task
Order Passing
Description
Task
Use Cases
Order Exceptions
Description
Task
Options
Options on TT
Description
Videos
Options Chain
Description
Task
Use Cases
Videos
Reference
Options Trade Monitor
Description
Task
Videos
Reference
Vol Curve Manager
Description
Task
Use Cases
Videos
Reference
Electronic Eye
Description
Task
Videos
Reference
RFQ Viewer
Description
Task
Videos
Reference
RFQ with Counterparties
Description
Task
Counterparty Manager
Description
Task
Strategy Creation
Description
Task
Use Cases
Reference
Options Risk
Description
Task
Videos
Reference
Options Risk Matrix
Description
Task
Videos
Reference
Watchlist
Description
Task
Videos
Reference
Expiration Manager
Description
Task
Volatility Calculator
Description
Task
TT Uncovered 2.0
Description
Task
TT Uncovered 3.0
Description
Task
QuikStrike
Description
Task
Spread Trading
Autospreader
Description
Task
Use Cases
Videos
Reference
Autospreader Rules
Description
Task
Videos
Reference
Hedge Manager
Description
Task
Videos
Reference
Trading in Yield
Description
Task
Use Cases
Reference
Aggregator
Description
Task
Videos
Reference
Algo Trading
Algo Dashboard
Description
Task
Videos
Reference
Template Manager
Description
Task
Order Management Algos (OMAs)
Autotrader
Description
Task
Reference
Videos
Excel integration with TT
Description
Task
Videos
Reference
Market-Making Algos
Analytics
Charts
Description
Technical Indicators
Task
Videos
Reference
Trader Analytics
Description
Task
Reference
ADL
ADL Overview
Introduction to ADL
Description
Task
Videos
Reference
ADL Basic Concepts
Description
Task
Reference
Building your first algo
Lessons
Advanced concepts
Description
Task
Case Studies
Jump blocks
Group blocks
Virtualized blocks
Library blocks
Trading Blocks
Discrete blocks
Arithmetic blocks
Basic blocks
Logic blocks
Miscellaneous blocks
Setup
Setup Overview
Getting Started
Description
Task
Videos
Reference
Supported Order Types and TIFs
Company Administration
Connections
Description
Task
Videos
Reference
Accounts
Description
Task
Videos
Use Cases
Reference
Users
Description
Task
Videos
Reference
Company
Description
Task
Reference
Order Tag Defaults
Description
Task
Account Administrators
Description
Task
TT Premium Services
Description
Task
TT Access
Description
Task
Advanced Features
Description
Risk Management
Risk Administration
Description
Task
Risk Limits
Description
Task
Videos
Reference
Pre-Trade Portfolio Risk
Description
Task
Reference
Order Cross Prevention
Description
Task
Videos
KRM Limits
Description
Task
TT® OMS
TT OMS Administration
Description
Task
Use Cases
Reference
Exchanges: Americas
B3
Description
Task
CBOE
Description
Task
Cboe FX
Description
Task
Reference
CFE
Description
Task
CME
Description
Task
Dealerweb
Description
Task
EBS Direct
Description
Task
EBS Market
Description
Task
Fenics
Description
Task
FMX
Description
Task
FMX_USTF
Description
Task
Goldman Sachs Commodity Blocks (GSCB)
Description
Task
Referece
ICE
Description
Task
MexDer
Description
Task
MIAX_FUT_CH
Description
Task
MIAX_FUT_NY
Description
Task
MX
Description
Task
Nodal
Description
Task
NFI
Task
Exchanges: EMEA
ATHEX
Description
Task
BIST
Description
Task
DGCX
Description
Task
EEX
Description
Task
EPEX SPOT
Description
Task
Reference
Eris
Description
Task
Eurex
Description
Task
Videos
Euronext
Description
Task
GFO-X
Description
Task
ICE_L
Description
Task
JSE
Description
Task
LME
Description
Task
LME NTP
Description
Task
LSE
Description
Task
MEFF
Description
Task
NDAQ_EU
Description
Task
NASDAQ_NED
Description
Task
Nord Pool
Description
Task
Reference
WSE
Description
Task
Exchanges: Asia/Pacific
ABX
Description
Task
ASX
Description
Task
FEX
Description
Task
HKEx
Description
Task
JPX
Description
Task
NSE
Description
Task
NZX
Description
Task
SGX
Description
Task
SGX GIFT
Description
Task
TAIFEX
Description
Task
TFEX
Description
Task
TFX
Description
Task
CoinFLEX
Task
Exchanges: Crypto
Coinbase
Description
Task
Kraken
Description
Task
FIX Support
FIX Ruleset
Description
Task
FIX Sessions
Description
Task
Secondary Accounts
Description
Task
Monitor
TT Mobile
TT Backtesting
APIs
TT REST API 2.0
Getting Started
API Reference
TT REST API 2.0 (UAT)
Getting Started
API Reference
TT .NET SDK
Getting started with TT .NET SDK
Creating the application framework
Working with instruments
Subscribing for market data
More about prices
An in-depth look at the Price class
Working with orders and fills
Handling trade subscriptions
Working with trade subscriptions
Working with Algos
Algo Server
TT Order Types
TT Premium Order Types
Advanced Concepts and Options
Appendix
TT CORE SDK
Getting Started with TT Core SDK
Creating Application Framework
Working With Instruments
Subscribing for Market Data
Working with Orders and Fills
Creating a TT Application Server
Appendix
TT Trade Surveillance
Overview
Using TT Trade Surveillance
Cluster View
Core Models
Market Abuse Models
Cross Product Models
Spoofing Models
Improperly Matched Trade Models
Market Rate Models
Trading Behaviors Models
Miscellaneous Models
Configurable Models
Reports
Reference
TT FIX Services
TT FIX General
Getting Started
FIX Message Structure
Session messages
TT FIX Order Routing
Overview
TT FIX message conversations
Supported application messages
TT FIX Market Data
Overview
TT FIX message conversations
Supported application messages
TT FIX Drop Copy Out
Overview
TT FIX Message Conversations
Supported application messages
Compliance Feed messages
TT FIX Drop Copy In
Overview
Supported application messages
TT FIX Gateway
Getting Started
FIX Message Structure
Components
Session messages
Price Gateway Messages
Order Gateway Messages
TT FIX Recovery
Overview
FIX Recovery Methods
Supported application messages
Compliance Feed Messages
MiFID II Support

TT Ladder Overlay

On this page

This view provides an invaluable tool for market analysts and surveillance teams, extending far beyond simple observation of instruments. By simultaneously presenting the order book depth for two related instruments, the Dual Ladder facilitates the overlay of granular transactional data, offering profound insights into a trader’s behavior and market impact. Analysts can precisely track how a trader’s orders affect the liquidity and price formation within one or both order books. This includes:

  • Impact Assessment: Visually determining the immediate and sustained impact of an order (or a sequence of orders) on the displayed quantity and price levels of the order book.
  • Order Residency: Pinpointing exactly how long a resting order remained in the book before execution, modification, or cancellation, offering crucial context for intent.
  • Book Proximity: Analyzing the distance of a trader’s order from the top of the book (best bid/offer) over time, which is a key indicator of aggressive or passive trading strategies.

This comprehensive visualization is particularly helpful in the detection and investigation of market abuse patterns, such as spoofing, layering, and other manipulative trading clusters. The ability to see the transactional footprint directly against the backdrop of real-time order book depth for potentially linked instruments drastically reduces the time and complexity involved in identifying suspicious activity and building a strong evidentiary chain.
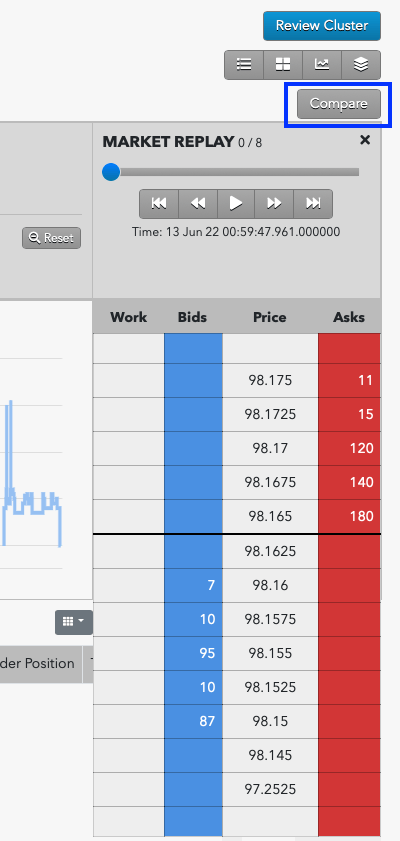
Ladder view

The Ladder view is a research tool that provides users with a frame-by-frame replay of the trading activity overlaid with Level 2 market data on a ladder-style interface. The ladder is 10 ticks deep and displays all market data, including the orders for each relevant participant in the order book. Users can stop, start and rewind the playback of the activity within a given cluster in order to gain a precise understanding of the sequence of events that occurred in the order book and how the trader’s orders impacted the market.

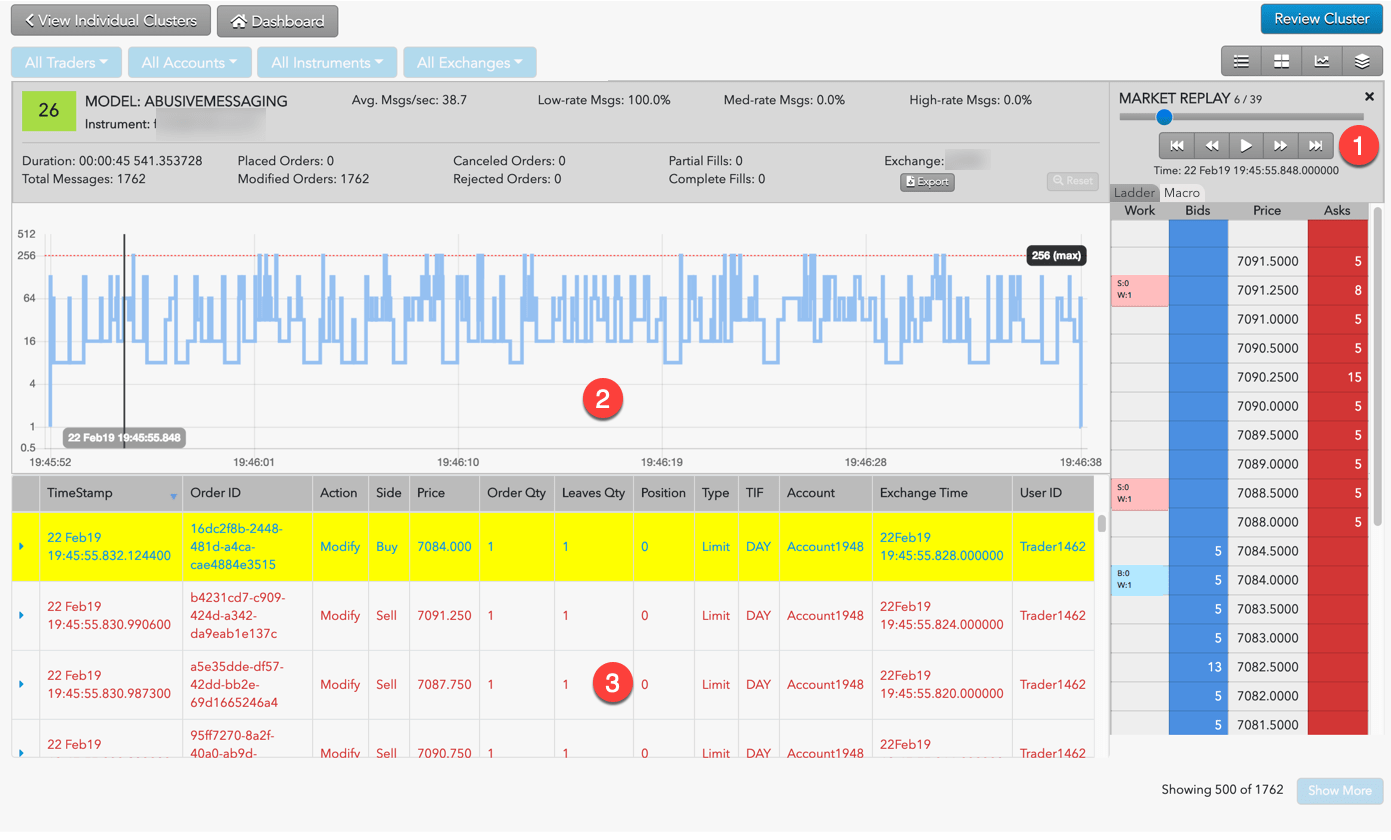
The ladder view includes the following:

  1. Interactive display of the market ladder for the specified time frame.
  2. Graph of trading activity showing buy and sell orders along with a bar indicating the current time in the replay.
  3. List of Audit Trail messages that comprise the activity included in the Market Replay.

Click Play to watch the market react as the order activity in the audit messages are replayed. As the market replays, a vertical bar tracks the progress in the graph and the audit messages are added as they occur. The Audit Message section lists the history of every audit message generated from the start of the replay to the current point in time of the market replay. You can start, stop and rewind the activity to help get a clearer picture of potentially problematic trading activity.

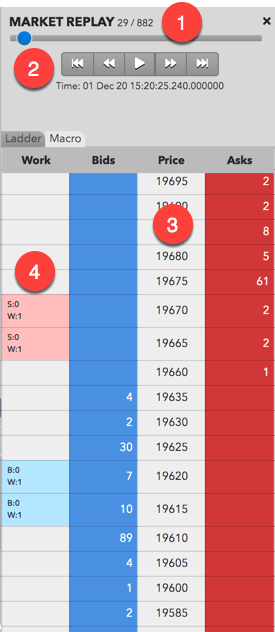
The market replay includes the following:

  1. Total number of frames in the replay and the frame number currently being displayed.
  2. Interactive controls to play and rewind trading activity in the ladder.
  3. Price ladder and state of the market at the indicated time.
  4. The trader’s working, displayed, undisclosed, and filled quantity at a price level.

Working order display in the Ladder view

When working orders are shown in the market replay, the corresponding cell in the working orders Work column contains abbreviations and colors to assist you in tracking and managing your working orders. The text and colors vary based on order type and order status. Refer to the following table for a description of the abbreviations and colors that appear in the working orders column.

Work Column DisplayDescription
  Appears for working buy or sell orders. The cell is highlighted blue for buy orders, red for sell orders or yellow when the price level contains both buy and sell orders. Abbreviations include:W — Working order quantity.B — Order quantity bought.S — Order quantity sold.E — Sum of order quantities when a price level has both buy and sell orders.
  Appears when TT order types (e.g., TT Time Sliced) or native order types (Iceberg) with disclosed and undisclosed quantities were submitted. The cell is highlighted blue for buy orders, red for sell orders or yellow when the price level contains both buy and sell orders. Abbreviations include:W — Working order quantity.B — Order quantity bought.S — Order quantity sold.E — Sum of order quantities when a price level has both buy and sell orders.D — Disclosed order quantity.U — Undisclosed order quantity
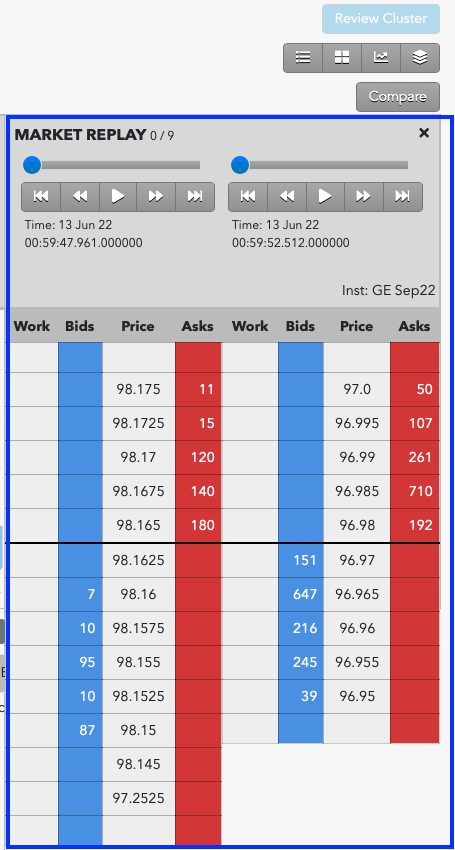
Dual Ladder View

The Dual Ladder View allows users to compare and view a related instrument in a second ladder in addition to the ladder from any Trade Surveillance cluster. When enabled, users can view the trader’s activity in the cluster specific instrument while loading any instrument in a second ladder.

The second ladder displays market activity that occurs at the same time as the first ladder. This allows you to review the potential market impact of the trader’s activity in a similar, related product, or to demonstrate that the user’s activity in the cluster was due to a change in market conditions in a separate instrument.

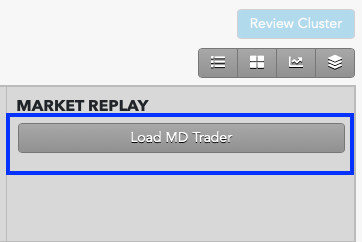
To view a second instrument in Dual Ladder View:

  1. Open the cluster you wish to review and click the Load MD Trader button.
  2. Above the MD Trader, click the Compare button.
  3. Market Explorer window opens allowing you to find and select the product you wish to compare.Note: You must have market data enabled for the exchange and products you want to compare.
  4. Press the Select Instrument button. The second ladder appears showing market data from the new instrument.