


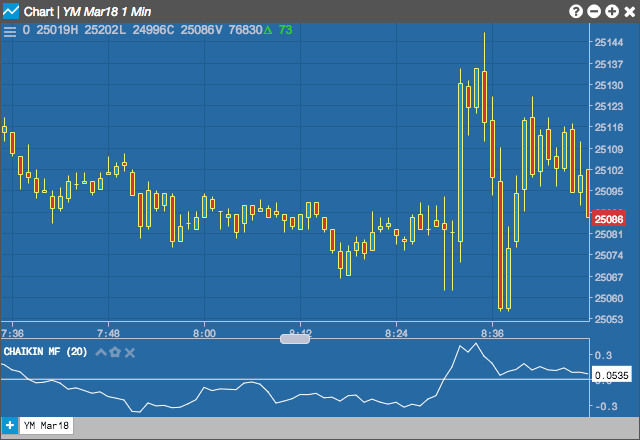
The Chaikin Money Flow (CMF) indicator measures Money Flow Volume over a period of time to determine buying and selling pressure by comparing the closing price in relation to the high-low range and the volume. When the CMF is above zero, it can indicate buying pressure; likewise, it indicates selling pressure when the CMF is below zero. Values farther away from zero indicate greater pressures.
When CMF crosses the zero Line, it can identify a potential trend reversal.
Configuration Options
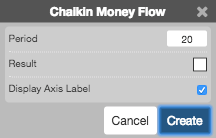
- Period: Number of bars to use in the calculations.
- Color Selectors: Colors to use for graph elements.
- Display Axis Label: Whether to display the most recent value on the Y axis.
Formula
\[CMF = \frac{\sum_{1}^{n} Money\;Flow\;Volume}{\sum_{1}^{n} Volume}\]
where:
\[Money\;Flow\;Volume = Money\;Flow\;Multiplier_{n} \times Volume_{n}\]
\[ Money\;Flow\;Multiplier = \frac{\left( (Close_{n}-Low_{n}) – (High_{n} – Close_{n}) \right)} {(High_{n}-Low_{n})} \]