


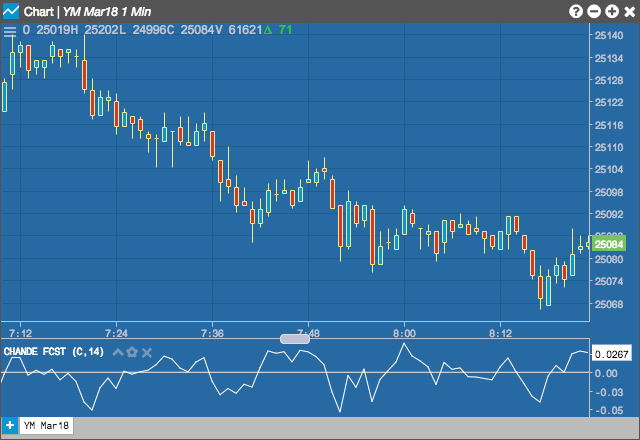
The Chande Forecast Oscillator plots the percentage difference between the closing price and the n-period linear regression forecasted price. The oscillator is above zero when the forecast price is greater than the closing price and less than zero if it is below.
Configuration Options
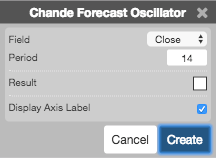
Field: Price or combination of prices to use as the base for average calculations. Possible values include:
-
Open
-
High
-
Low
-
Close
-
Adjusted Close
- HL/2 \( \left ( \frac{High + Low}{2} \right ) \)
- HLC/3 \( \left ( \frac{High + Low + Close}{3} \right ) \)
- HLCC/4 \( \left ( \frac{High + Low + Close + Close}{4} \right ) \)
- OHLC/4 \( \left ( \frac{Open + High + Low + Close}{4} \right ) \)
- Period: Number of bars to use in the calculations.
- Color Selectors: Colors to use for graph elements.
- Display Axis Label: Whether to display the most recent value on the Y axis.
Formula
\[CFO_{i} = \frac{(Close_{i} – Linear\;Regression)\times 100}{Close_{i}} \]
where linear regresion is calcualted as
\[slope\;=\;m\;=\;\frac{\sum_{i=1}^{n}(x_{i} – \bar{x})(y_{i} – \bar{y})}{\sum_{i=1}^{n}(x_{i} – \bar{x})^{2}}\]
\[intercept\;=\;b\;=\;\bar{y} – m\bar{x}\]