


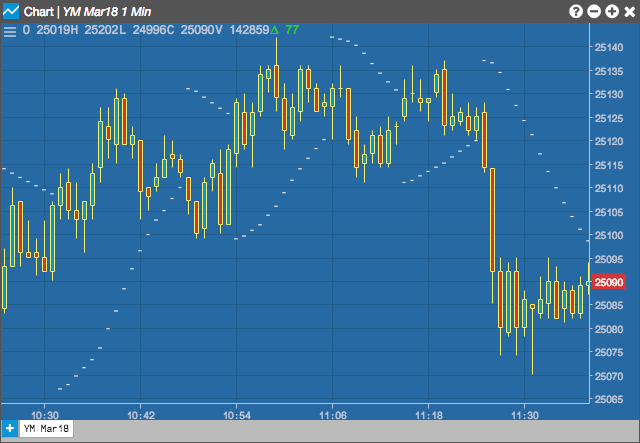
The Parabolic Stop and Reverse (SAR) calculates trailing stop points to use with long and short positions. The SAR was published by J. Welles Wilder as part of a complete trend following
system. The dotted lines above the price designate trailing stops for short positions; those below the price are sell stops for long positions
Configuration Options

- Minimum AF: Minumum acceleration factor
- Maximum AF: Maximum acceleration factor
- Color Selectors: Colors to use for graph elements.
- Display Axis Label: Whether to display the most recent value on the Y axis.
Formula
For new long positions:
\[ SAR = P + (A * ( H – P )) \]
Where:
- SAR = the long Stop and Reverse price at which the position is reversed from Long to Short
- P = the previous period’s SAR
- A = the acceleration factor.
- H = the highest price since the current long trade was opened on a buy stop order.
For new short positions:
\[ SAR = P – (A * ( L – P )) \]
Where:
- S = the short side buy Stop and Reverse Price (SAR) at which the position is reversed from short to long
- P = the previous period’s SAR
- A = the acceleration factor.
- L = the lowest price since the current short trade was opened on a sell stop order.