


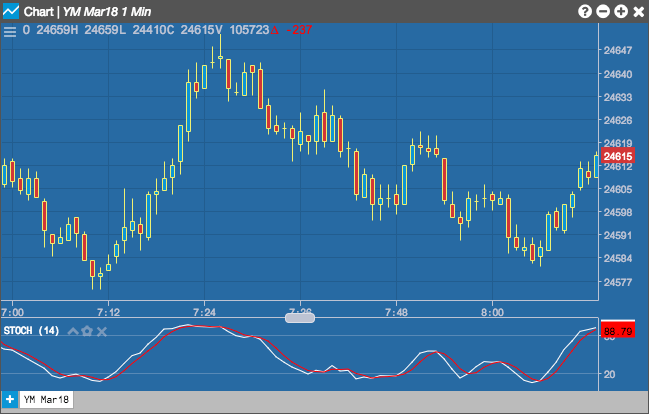
The Stochastic Oscillator (Stoch) normalizes price as a percentage between 0 and 100. Normally two lines are plotted, the %K line and a moving average of the %K which is called %D. A slow stochastic can be created by initially smoothing the %K line with a moving average before it is displayed. The length of this smoothing is set in the Slow K Period. Without the initial smoothing ( i.e., setting the Slow K Period to a value of 1 ) the %K becomes the ‘Raw %K’ value, and is also known as a fast stochastic.
Configuration Options
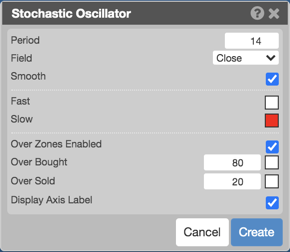
- Period: Number of bars to use in the calculations.
- Field: Price or combination of prices to use as the base for average calculations. Possible values include:
- Open
- High
- Low
- Close
- Adjusted Close
- HL/2 ( left ( frac{High + Low}{2} right ) )
- HLC/3 ( left ( frac{High + Low + Close}{3} right ) )
- HLCC/4 ( left ( frac{High + Low + Close + Close}{4} right ) )
- OHLC/4 ( left ( frac{Open + High + Low + Close}{4} right ) )
- Smooth: Whether to smooth the curve.
- Color Selectors: Colors to use for graph elements.
- Over Zones Enabled: Whether to shade the area between the plot and the horizontal overbought and oversold levels.
- Over Bought: Overbought quantity
- Over Sold: Oversold quantity
- Display Axis Label: Whether to display the most recent value on the Y axis.
Formula
Fast %K = 100 SMA ( ( ( Close – Low ) / ( High – Low ) ),Time Period )
Slow %K = SMA ( Fast %K, Kma )
Slow %D = SMA ( Slow %K, Dma )
Where:
- Close = the current closing price
- Low = the lowest low in the past n periods
- High = the highest high in the past n periods
- Kma = Period of Moving Average used to smooth the Fast %K Values
- Dma = Period of Moving Average used to smooth the Slow %K Values