


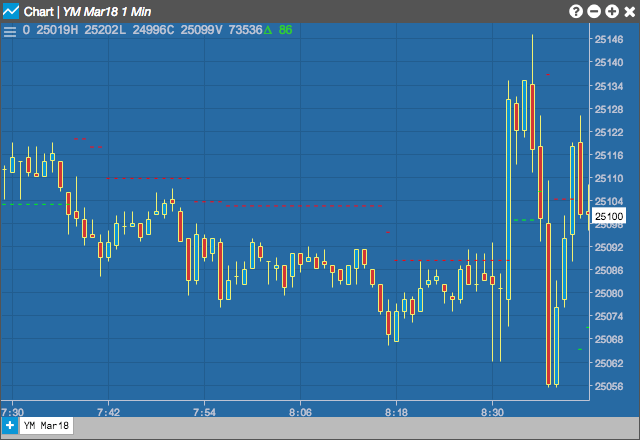
The ATR Trailing Stops indicator sets trailing stops to close positions based on the average true range. Wider stops indicate more volatility, while narrower stops indicate less volatility.
Configuration Options
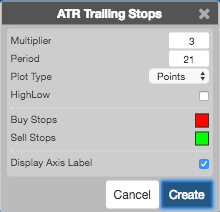
- Multiplier: Multiples vary between 2.5 and 3.5 ATR, with 3 being the default.
- Period: Number of bars to use in the calculations. ATR typically uses between a 5- and 21-period span.
-
Plot Type: Format for the stop, which can be set by setting the plot type to:
- Points
- Squarwave
- HighLow: The High/Low option bases the stop on the previous period’s high for up trends and previous period’s low for down trends.
- Color Selectors: Colors to use for graph elements.
- Display Axis Label: Whether to display the most recent value on the Y axis.
Formula
TR (True Range) is defined as the greatest of the following:
- Current high minus the current low
- Current high minus the previous close (absolute value)
- Current low minus the previous close (absolute value)
ATR = simple moving average of TR