


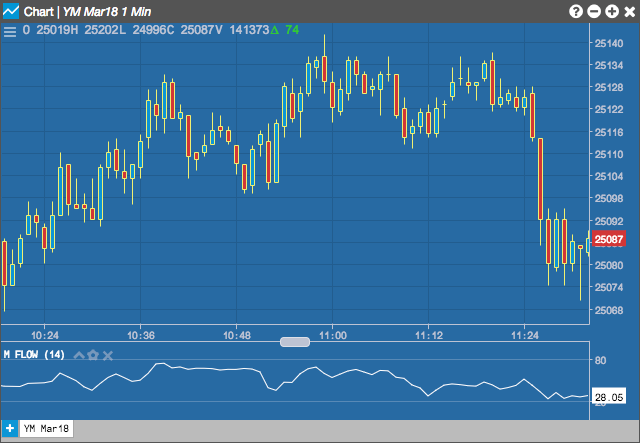
The Money Flow Index (MFI), developed by Gene Quong and Avrum Soudack, uses both price and volume to measure buying and selling pressure. The MFI value ranges from 0 to 100. A MFI value above 80 indicates a possible overbought situation and a value below 20 indicates a possible oversold condition.
Configuration Options

- Period: Number of bars to use in the calculations.
- Color Selectors: Colors to use for graph elements.
- Over Zones Enabled: Whether to shade the area between the plot and the horizontal overbought and oversold levels.
- Over Bought: Overbought quantity
- Over Sold: Oversold quantity
- Display Axis Label: Whether to display the most recent value on the Y axis.
Formula
The formula is essentially a volume-weighted relative strength index (RSI). However, instead of using simple close prices, MFI uses the typical price multiplied by volume. The result is then used in the RSI calculation as a ratio of average volume weighted size of the up-closes over the past “n” periods and compared to the average volume weighted size of the down-closes. The result is indexed between 0 and 100.
[Pivot = frac{(High + Low + Close)}{3}]
[MF = Money;Flow = begin{pmatrix} if;Pivot_{t} > Pivot_{t-1}, & Pivot times Volume if;Pivot_{t}
[MR = Money;Ratio = frac{sum_{1}^{n} Positive;MF}{sum_{1}^{n} Negative;MF}]
over a user defined n-periods
[MFI = 100 – frac{100}{1+ MR_{n-periods}} ]