


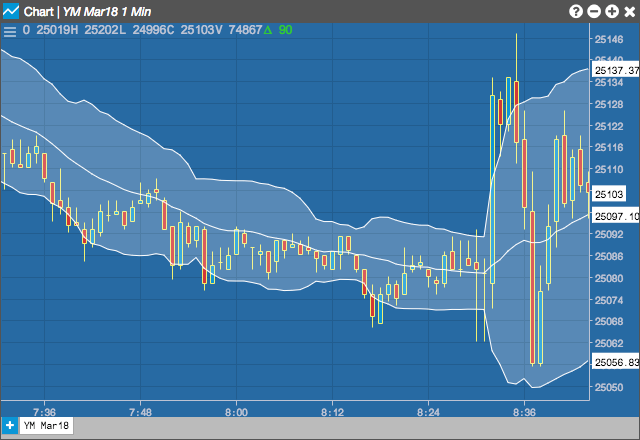
The Bollinger Bands are used to find market turning points, potential trading range breakouts, and trend exhaustion. The bands form an envelope drawn a number of standard deviations above and below a moving average. The Bollinger Band study created by John Bollinger plots upper and lower volatility bands around the price of the instrument. The width of the bands are based on the standard deviation of the user defined price from a moving average of n-periods.
Configuration Options
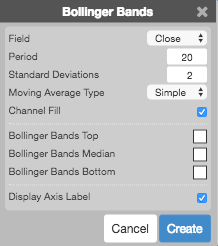
Field: Price or combination of prices to use as the base for average calculations. Possible values include:
-
Open
-
High
-
Low
-
Close
-
Adjusted Close
- HL/2 \( \left ( \frac{High + Low}{2} \right ) \)
- HLC/3 \( \left ( \frac{High + Low + Close}{3} \right ) \)
- HLCC/4 \( \left ( \frac{High + Low + Close + Close}{4} \right ) \)
- OHLC/4 \( \left ( \frac{Open + High + Low + Close}{4} \right ) \)
- Period: Number of bars to use in the calculations.
- Standard Deviations: Number of standard deviations above and below the average to draw the bands.
- Moving Average Type: Type of moving average to use in the calculations:
- Simple
- Exponential
- Time Series
- Triangular
- Variable
- VIDYA
- Weighted
- Welles Winder
- Hull
- Double Exponential
- Triple Exponential
- Channel Fill: Whether to shade the area between the top and bottom bands.
- Color Selectors: Colors to use for graph elements.
- Display Axis Label: Whether to display the most recent value on the Y axis.
Formula
\[Middle\;Band = n\text{-}period\;moving\;average\]
\[
Upper\;Band = Middle\;Band + \left( y \times n\text{-}period\;Standard\;Deviation \right)
\]
\[
Lower\;Band = Middle\;Band – \left( y \times n\text{-}period\;Standard\;Deviation \right)
\]
where:
\[ Standard\;Deviation = \sqrt{d}\]
with
\[ d = \frac{(P_{1}-MA)^{2}+(P_{2}-MA)^{2}+…+(P_{n}-MA)^{2}}{n}\]
where
\[ P_{n} =\;the\;user\;defined\;bar\;value\;of\;the\;n^{th}\;bar\]
\[ MA =\;the\;user\;defined\;n\text{-}period\;moving\;average\]