


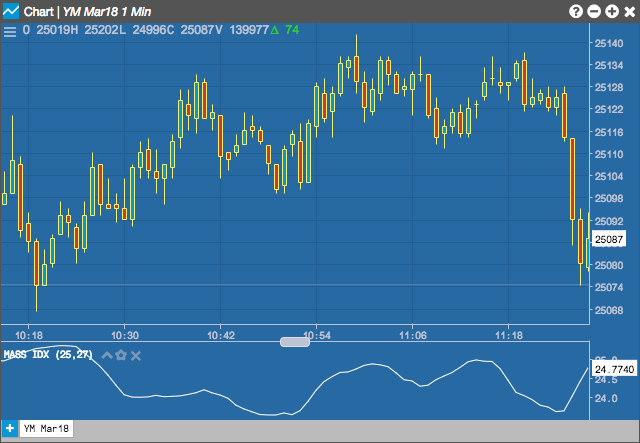
The Mass Index indicator, developed by Donald Dorsey, uses the bar range to identify trend reversals based on range expansions. It is more of a volatility indicator as it does not have a directional bias. It identifies trending and congession areas, which can occur before change in trend.
Configuration Options
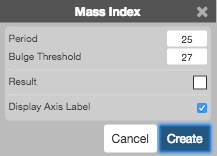
- Period: Number of bars to use in the calculations.
- Bulge Threshold: TBD
- Color Selectors: Colors to use for graph elements.
- Display Axis Label: Whether to display the most recent value on the Y axis.
Formula
[EMA_{1} = 9-period;EMA;of;the;range;(H-L)]
[DEMA_{1} = 9-period;EMA_{1}]
[EMA Ratio = frac{EMA_{1}}{DEMA_{1}}]
[MI = 25-period;sum;of;the;EMA;Ratio]