Trade
Overview
TT Platform
Description
Task
Browser Access
Description
Task
Videos
TT Desktop
Description
Task
Videos
Reference
Workspace Windows
Description
Task
Videos
Widgets
Description
Task
Preferences
Description
Viewing Market Data
Time and Sales
Task
Reference
Description
Depth
Description
Task
Reference
Market Grid
Description
Task
Videos
Reference
Product Grid
Description
Task
Reference
Spread Matrix
Description
Task
Videos
Reference
Basic Order Entry
TT Order Types
Description
Task
Videos
Reference
Case Studies
TT Premium Order Types
Description
Task
Reference
Order Ticket
Description
Task
Use Cases
Reference
MD Trader®
Description
Task
Videos
Reference
Order Profiles
Description
Task
Reference
Routing Rules
Description
Task
Blocktrader
Description
Task
Videos
Reference
Trading Crypto on TT
Description
Task
Videos
Reference
Trading on B3
Order Management
Order Book
Description
Task
Reference
Floating Order Book
Description
Task
Reference
Fills
Description
Task
Reference
Positions
Description
Task
Reference
Orders and Fills
Description
Task
Reference
Audit Trail
Description
Task
Reference
Audit Query
Description
Task
Reference
Account List
Description
Task
Videos
Reference
Position Manager
Description
Task
Reference
Alert Manager and Alert Viewer
Description
Task
Videos
Reference
Account & User Restrictions
Description
Task
Reference
Balances
Description
Task
Reference
TT® OMS
Care Orders
Description
Task
Videos
Reference
Lock and Release
Description
Task
Bulking
Description
Task
Videos
Stitching and Splitting
Description
Task
Combining
Description
Task
Order Passing
Description
Task
Use Cases
Order Exceptions
Description
Task
Options
Options on TT
Description
Videos
Options Chain
Description
Task
Use Cases
Videos
Reference
Options Trade Monitor
Description
Task
Videos
Reference
Vol Curve Manager
Description
Task
Use Cases
Videos
Reference
Electronic Eye
Description
Task
Videos
Reference
RFQ Viewer
Description
Task
Videos
Reference
RFQ with Counterparties
Description
Task
Counterparty Manager
Description
Task
Strategy Creation
Description
Task
Use Cases
Reference
Options Risk
Description
Task
Videos
Reference
Options Risk Matrix
Description
Task
Videos
Reference
Watchlist
Description
Task
Videos
Reference
Expiration Manager
Description
Task
Volatility Calculator
Description
Task
TT Uncovered 2.0
Description
Task
TT Uncovered 3.0
Description
Task
QuikStrike
Description
Task
Spread Trading
Autospreader
Description
Task
Use Cases
Videos
Reference
Autospreader Rules
Description
Task
Videos
Reference
Hedge Manager
Description
Task
Videos
Reference
Trading in Yield
Description
Task
Use Cases
Reference
Aggregator
Description
Task
Videos
Reference
Algo Trading
Algo Dashboard
Description
Task
Videos
Reference
Template Manager
Description
Task
Order Management Algos (OMAs)
Autotrader
Description
Task
Reference
Videos
Excel integration with TT
Description
Task
Videos
Reference
Market-Making Algos
Analytics
Charts
Description
Technical Indicators
Task
Videos
Reference
Trader Analytics
Description
Task
Reference
ADL
ADL Overview
Introduction to ADL
Description
Task
Videos
Reference
ADL Basic Concepts
Description
Task
Reference
Building your first algo
Lessons
Advanced concepts
Description
Task
Case Studies
Jump blocks
Group blocks
Virtualized blocks
Library blocks
Trading Blocks
Discrete blocks
Arithmetic blocks
Basic blocks
Logic blocks
Miscellaneous blocks
Setup
Setup Overview
Getting Started
Description
Task
Videos
Reference
Supported Order Types and TIFs
Company Administration
Connections
Description
Task
Videos
Reference
Accounts
Description
Task
Videos
Use Cases
Reference
Users
Description
Task
Videos
Reference
Company
Description
Task
Reference
Order Tag Defaults
Description
Task
Account Administrators
Description
Task
TT Premium Services
Description
Task
TT Access
Description
Task
Advanced Features
Description
Risk Management
Risk Administration
Description
Task
Risk Limits
Description
Task
Videos
Reference
Pre-Trade Portfolio Risk
Description
Task
Reference
Order Cross Prevention
Description
Task
Videos
KRM Limits
Description
Task
TT® OMS
TT OMS Administration
Description
Task
Use Cases
Reference
Exchanges: Americas
B3
Description
Task
CBOE
Description
Task
Cboe FX
Description
Task
Reference
CFE
Description
Task
CME
Description
Task
Dealerweb
Description
Task
EBS Direct
Description
Task
EBS Market
Description
Task
Fenics
Description
Task
FMX
Description
Task
FMX_USTF
Description
Task
Goldman Sachs Commodity Blocks (GSCB)
Description
Task
Referece
ICE
Description
Task
MexDer
Description
Task
MIAX_FUT_CH
Description
Task
MIAX_FUT_NY
Description
Task
MX
Description
Task
Nodal
Description
Task
NFI
Task
Exchanges: EMEA
ATHEX
Description
Task
BIST
Description
Task
DGCX
Description
Task
EEX
Description
Task
EPEX SPOT
Description
Task
Reference
Eris
Description
Task
Eurex
Description
Task
Videos
Euronext
Description
Task
GFO-X
Description
Task
ICE_L
Description
Task
JSE
Description
Task
LME
Description
Task
LME NTP
Description
Task
LSE
Description
Task
MEFF
Description
Task
NDAQ_EU
Description
Task
NASDAQ_NED
Description
Task
Nord Pool
Description
Task
Reference
WSE
Description
Task
Exchanges: Asia/Pacific
ABX
Description
Task
ASX
Description
Task
FEX
Description
Task
HKEx
Description
Task
JPX
Description
Task
NSE
Description
Task
NZX
Description
Task
SGX
Description
Task
SGX GIFT
Description
Task
TAIFEX
Description
Task
TFEX
Description
Task
TFX
Description
Task
CoinFLEX
Task
Exchanges: Crypto
Coinbase
Description
Task
Kraken
Description
Task
FIX Support
FIX Ruleset
Description
Task
FIX Sessions
Description
Task
Secondary Accounts
Description
Task
Monitor
TT Mobile
TT Backtesting
APIs
TT REST API 2.0
Getting Started
API Reference
TT REST API 2.0 (UAT)
Getting Started
API Reference
TT .NET SDK
Getting started with TT .NET SDK
Creating the application framework
Working with instruments
Subscribing for market data
More about prices
An in-depth look at the Price class
Working with orders and fills
Handling trade subscriptions
Working with trade subscriptions
Working with Algos
Algo Server
TT Order Types
TT Premium Order Types
Advanced Concepts and Options
Appendix
TT CORE SDK
Getting Started with TT Core SDK
Creating Application Framework
Working With Instruments
Subscribing for Market Data
Working with Orders and Fills
Creating a TT Application Server
Appendix
TT Trade Surveillance
Overview
Using TT Trade Surveillance
Cluster View
Core Models
Market Abuse Models
Cross Product Models
Spoofing Models
Improperly Matched Trade Models
Market Rate Models
Trading Behaviors Models
Miscellaneous Models
Configurable Models
Reports
Reference
TT FIX Services
TT FIX General
Getting Started
FIX Message Structure
Session messages
TT FIX Order Routing
Overview
TT FIX message conversations
Supported application messages
TT FIX Market Data
Overview
TT FIX message conversations
Supported application messages
TT FIX Drop Copy Out
Overview
TT FIX Message Conversations
Supported application messages
Compliance Feed messages
TT FIX Drop Copy In
Overview
Supported application messages
TT FIX Gateway
Getting Started
FIX Message Structure
Components
Session messages
Price Gateway Messages
Order Gateway Messages
TT FIX Recovery
Overview
FIX Recovery Methods
Supported application messages
Compliance Feed Messages
MiFID II Support

Using TT TWAP to Drive TT Autospreader Instruments

On this page

The TT Time Weighted Average Price (TWAP) synthetic order type may be used to fill large orders when a trader wants to keep the executed trade price as close as possible to the average market price without alerting other market participants to order volume. TT TWAP supports the ability to drive TT Autospreader instruments in addition to an exchange’s native contracts.

Case Study Overview

In this case study, a fund manager believes the U.S. Technology sector is undervalued relative to the broader market and uses a ratio spread using CME Index Futures to reflect this view. Using TT Autospreader, the fund manager looks to buy Micro E-Mini Nasdaq 100 Futures while simultaneously selling Micro E-Mini S&P 500 Futures.

Spreads can be profitable in rising or falling markets. In this example, if the Technology sector, (as measured by the Nasdaq 100 Index) outperforms the index for large cap stocks (as measured by the S&P 500 Index), the spread should show a profit.

To reduce market impact while seeking a fill price that averages across the course of the day, the fund manager decides to use the TT TWAP order type.

Constructing the Spread

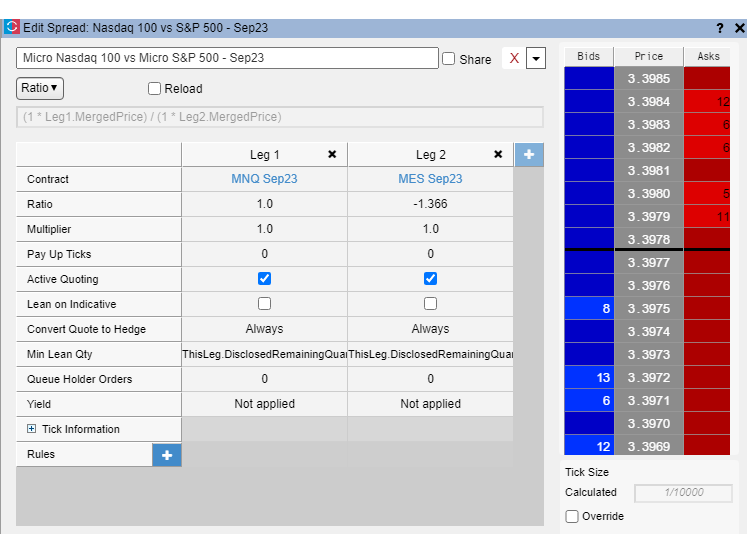
First, the fund manager must determine the spread ratio. This equals the ‘weighting’ of each leg of the spread. In this example, the fund manager bases the spread ratio on the notional value of the futures contracts.

Using the following values:

Micro E-mini Nasdaq 100 Futures

Contract unit: $2 x Micro Nasdaq-100 Index (MNQ Sep23 @ 15351.00)

15351.00 x $2.00 = $30,702

Micro E-mini S&P 500 Futures

Contract unit: $5 x S&P 500 Index (MES Sep23 @ 4492.50)

4492.50 x $5.00 = $22,462.5

Results in the following calculation:

Spread Ratio = $30,702 divided by $22,462.5 = 1.366

This implies a ratio of 1 by 1.366 meaning that for each contract of E-mini Nasdaq-100 Futures that is bought, 1.366 contracts of E-mini S&P 500 Futures must be sold.

Calculating Order Size

The fund manager seeks an approximate exposure of $1,000,000. The margin requirements for this position is included in the Margin Requirements section below.

Based on the notional values of each of the calculated futures contracts, the fund manager trades 33 units of the spread configured in the previous step.

33 x Micro EMini Nasdaq 100 ($30,702) = $1,013,166

45 x EMini S&P 500 ($22,462.5) = $1,010,812 (33 x 1.366)

Configuring TT TWAP

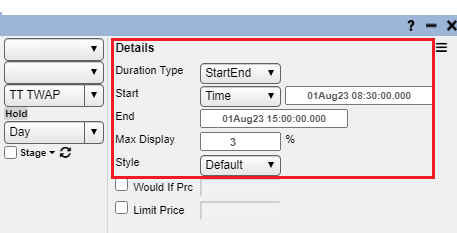
The fund manager wants to align the order with the trading hours of the equities cash session and sets the start and end time accordingly by selecting StartEnd from the Duration Type dropdown and keying in the desired times and dates.

In this example, the overall duration of the order will be 6 hours and 30 minutes (390 minutes).

A Max Display setting of 3% is chosen to ensure a quantity of 1 is used for each native exchange order. This value equals the total order quantity of 33 divided by 100 percent. The more frequently the orders enter the market; the closer the price will be to the average price across the duration of the order.

The Style of execution can be set to either Aggressive, Default, or Passive. In this example, the fund manager chooses Default to minimize the need to cross the market to achieve fills. More details on the behavior of each style can be found in the Time Weighted Average Price Order Parameters section of the help.

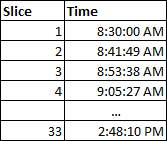
Based on the Duration, Max Display, and Style configured, TT TWAP releases an order for 1 unit of the spread approximately every 11 minutes and 49 seconds. This value equals the total order quantity of 33 divided by the total time of 390 minutes.

Executing the Order

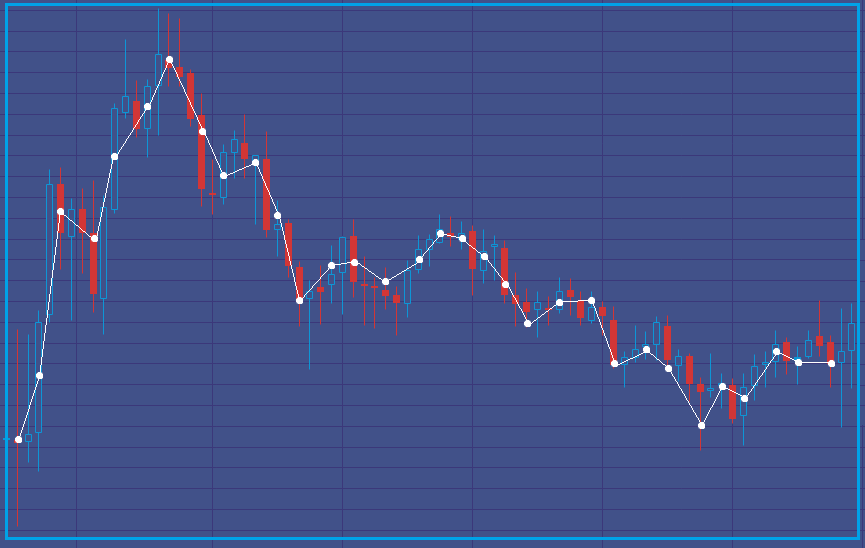
The 5-minute chart below is based on the spread price during the trading session and provides a visual representation of how an average execution price can be achieved using TT TWAP.

Each white dot is a fill towards completing the order for 33 units of the spread and shows how TT TWAP tracks the market. By submitting smaller quantity orders more frequently, the fund manager can better capture the average price across the duration of the order.

Trade Scenarios

Entry Price Scenario

Calculated Spread Price – 3.417

Note The calculated spread price equals the price of Micro E-Mini Nasdaq futures divided by the price of Micro E-Mini S&P 500 futures.

Average Fill Price Contract Quantity Notional Value Tick Value
MNQ Sep23 15351 33 $1,013,166.00 $0.50
MES Sep23 4492.5 45 $1,010,812.50 $1.25

Exit Price Scenario – 1

In this scenario, the Technology sector outperforms the broader market over the course of the trade. Specifically, the Nasdaq gains 5% and the S&P 500 gains 2%.

Calculated Spread Price – 3.518

Average Fill Price Contract Quantity Change in Ticks Profit/Loss (PnL) per leg
MNQU3 16118.5 32 3070 $49,120.00
MESU3 4582.25 44 359 -$19,745.00
Overall PnL $29,375.00

Exit Price Scenario – 2

In this scenario, the Technology sector declines relative to the broader market over the course of the trade. Both the Nasdaq and S&P 500 decline by 3%.

Calculated Spread Price – 3.417

Average Fill Price Contract Quantity Change in Ticks Profit/Loss (PnL) per leg
MNQ Sep23 14890.5 32 -1842 -$29,472.00
MES Sep23 4357.75 44 -539 $29,645.00
Overall PnL $173.00

Exit Price Scenario – 3

In this last scenario, the Technology sector underperformed the broader market over the course of the trade. Specifically the Nasdaq gains 3% and the S&P 500 gains 4%.

Calculated Spread Price – 3.384

Average Fill Price Contract Quantity Change in Ticks Profit/Loss (PnL) per leg
MNQ Sep23 15811.5 32 1842 $29,472.00
MES Sep23 4672.25 44 719 -$39,545.00
Overall PnL -$10,073.00

Margin Requirements

Maintenance Margin Requirement

Per contract Contract Quantity Total
MNQ Sep23 $1,680.00 33 $55,440.00
MES Sep23 $1,120.00 45 $50,400.00
Subtotal $105,840.00

Margin Discount for Inter-Spread (MNQ vs MES)

CME allows a 70% discount on a 1 to 1 basis between the two contracts.

Per contract Contract Quantity 70% Discount
MNQ Sep23 $1,680.00 33 $16,632.00
MES Sep23 $1,120.00 33 $11,088.00
no discount
MES Sep23 $1,120.00 12 $13,440.00
Maintenance Margin after discount $41,160.00