Trade
Overview
TT Platform
Description
Task
Browser Access
Description
Task
Videos
TT Desktop
Description
Task
Videos
Reference
Workspace Windows
Description
Task
Videos
Widgets
Description
Task
Preferences
Description
Viewing Market Data
Time and Sales
Task
Reference
Description
Depth
Description
Task
Reference
Market Grid
Description
Task
Videos
Reference
Product Grid
Description
Task
Reference
Spread Matrix
Description
Task
Videos
Reference
Basic Order Entry
TT Order Types
Description
Task
Videos
Reference
Case Studies
TT Premium Order Types
Description
Task
Reference
Order Ticket
Description
Task
Use Cases
Reference
MD Trader®
Description
Task
Videos
Reference
Order Profiles
Description
Task
Reference
Routing Rules
Description
Task
Blocktrader
Description
Task
Videos
Reference
Trading Crypto on TT
Description
Task
Videos
Reference
Trading on B3
Order Management
Order Book
Description
Task
Reference
Floating Order Book
Description
Task
Reference
Fills
Description
Task
Reference
Positions
Description
Task
Reference
Orders and Fills
Description
Task
Reference
Audit Trail
Description
Task
Reference
Audit Query
Description
Task
Reference
Account List
Description
Task
Videos
Reference
Position Manager
Description
Task
Reference
Alert Manager and Alert Viewer
Description
Task
Videos
Reference
Account & User Restrictions
Description
Task
Reference
Balances
Description
Task
Reference
TT® OMS
Care Orders
Description
Task
Videos
Reference
Lock and Release
Description
Task
Bulking
Description
Task
Videos
Stitching and Splitting
Description
Task
Combining
Description
Task
Order Passing
Description
Task
Use Cases
Order Exceptions
Description
Task
Options
Options on TT
Description
Videos
Options Chain
Description
Task
Use Cases
Videos
Reference
Options Trade Monitor
Description
Task
Videos
Reference
Vol Curve Manager
Description
Task
Use Cases
Videos
Reference
Electronic Eye
Description
Task
Videos
Reference
RFQ Viewer
Description
Task
Videos
Reference
RFQ with Counterparties
Description
Task
Counterparty Manager
Description
Task
Strategy Creation
Description
Task
Use Cases
Reference
Options Risk
Description
Task
Videos
Reference
Options Risk Matrix
Description
Task
Videos
Reference
Watchlist
Description
Task
Videos
Reference
Expiration Manager
Description
Task
Volatility Calculator
Description
Task
TT Uncovered 2.0
Description
Task
TT Uncovered 3.0
Description
Task
QuikStrike
Description
Task
Spread Trading
Autospreader
Description
Task
Use Cases
Videos
Reference
Autospreader Rules
Description
Task
Videos
Reference
Hedge Manager
Description
Task
Videos
Reference
Trading in Yield
Description
Task
Use Cases
Reference
Aggregator
Description
Task
Videos
Reference
Algo Trading
Algo Dashboard
Description
Task
Videos
Reference
Template Manager
Description
Task
Order Management Algos (OMAs)
Autotrader
Description
Task
Reference
Videos
Excel integration with TT
Description
Task
Videos
Reference
Market-Making Algos
Analytics
Charts
Description
Technical Indicators
Task
Videos
Reference
Trader Analytics
Description
Task
Reference
ADL
ADL Overview
Introduction to ADL
Description
Task
Videos
Reference
ADL Basic Concepts
Description
Task
Reference
Building your first algo
Lessons
Advanced concepts
Description
Task
Case Studies
Jump blocks
Group blocks
Virtualized blocks
Library blocks
Trading Blocks
Discrete blocks
Arithmetic blocks
Basic blocks
Logic blocks
Miscellaneous blocks
Setup
Setup Overview
Getting Started
Description
Task
Videos
Reference
Supported Order Types and TIFs
Company Administration
Connections
Description
Task
Videos
Reference
Accounts
Description
Task
Videos
Use Cases
Reference
Users
Description
Task
Videos
Reference
Company
Description
Task
Reference
Order Tag Defaults
Description
Task
Account Administrators
Description
Task
TT Premium Services
Description
Task
TT Access
Description
Task
Advanced Features
Description
Risk Management
Risk Administration
Description
Task
Risk Limits
Description
Task
Videos
Reference
Pre-Trade Portfolio Risk
Description
Task
Reference
Order Cross Prevention
Description
Task
Videos
KRM Limits
Description
Task
TT® OMS
TT OMS Administration
Description
Task
Use Cases
Reference
Exchanges: Americas
B3
Description
Task
CBOE
Description
Task
Cboe FX
Description
Task
Reference
CFE
Description
Task
CME
Description
Task
Dealerweb
Description
Task
EBS Direct
Description
Task
EBS Market
Description
Task
Fenics
Description
Task
FMX
Description
Task
FMX_USTF
Description
Task
Goldman Sachs Commodity Blocks (GSCB)
Description
Task
Referece
ICE
Description
Task
MexDer
Description
Task
MIAX_FUT_CH
Description
Task
MIAX_FUT_NY
Description
Task
MX
Description
Task
Nodal
Description
Task
NFI
Task
Exchanges: EMEA
ATHEX
Description
Task
BIST
Description
Task
DGCX
Description
Task
EEX
Description
Task
EPEX SPOT
Description
Task
Reference
Eris
Description
Task
Eurex
Description
Task
Videos
Euronext
Description
Task
GFO-X
Description
Task
ICE_L
Description
Task
JSE
Description
Task
LME
Description
Task
LME NTP
Description
Task
LSE
Description
Task
MEFF
Description
Task
NDAQ_EU
Description
Task
NASDAQ_NED
Description
Task
Nord Pool
Description
Task
Reference
WSE
Description
Task
Exchanges: Asia/Pacific
ABX
Description
Task
ASX
Description
Task
FEX
Description
Task
HKEx
Description
Task
JPX
Description
Task
NSE
Description
Task
NZX
Description
Task
SGX
Description
Task
SGX GIFT
Description
Task
TAIFEX
Description
Task
TFEX
Description
Task
TFX
Description
Task
CoinFLEX
Task
Exchanges: Crypto
Coinbase
Description
Task
Kraken
Description
Task
FIX Support
FIX Ruleset
Description
Task
FIX Sessions
Description
Task
Secondary Accounts
Description
Task
Monitor
TT Mobile
TT Backtesting
APIs
TT REST API 2.0
Getting Started
API Reference
TT REST API 2.0 (UAT)
Getting Started
API Reference
TT .NET SDK
Getting started with TT .NET SDK
Creating the application framework
Working with instruments
Subscribing for market data
More about prices
An in-depth look at the Price class
Working with orders and fills
Handling trade subscriptions
Working with trade subscriptions
Working with Algos
Algo Server
TT Order Types
TT Premium Order Types
Advanced Concepts and Options
Appendix
TT CORE SDK
Getting Started with TT Core SDK
Creating Application Framework
Working With Instruments
Subscribing for Market Data
Working with Orders and Fills
Creating a TT Application Server
Appendix
TT Trade Surveillance
Overview
Using TT Trade Surveillance
Cluster View
Core Models
Market Abuse Models
Cross Product Models
Spoofing Models
Improperly Matched Trade Models
Market Rate Models
Trading Behaviors Models
Miscellaneous Models
Configurable Models
Reports
Wachlists
Reference
TT FIX Services
TT FIX General
Getting Started
FIX Message Structure
Session messages
TT FIX Order Routing
Overview
TT FIX message conversations
Supported application messages
TT FIX Market Data
Overview
TT FIX message conversations
Supported application messages
TT FIX Drop Copy Out
Overview
TT FIX Message Conversations
Supported application messages
Compliance Feed messages
TT FIX Drop Copy In
Overview
Supported application messages
TT FIX Gateway
Getting Started
FIX Message Structure
Components
Session messages
Price Gateway Messages
Order Gateway Messages
TT FIX Recovery
Overview
FIX Recovery Methods
Supported application messages
Compliance Feed Messages
MiFID II Support

Momentum Ignition

On this page

Momentum ignition trading patterns attempt to create directional price movement and then to capitalize on the result. Typically, momentum ignition is identified by a series of aggressive orders submitted in a short time span in an attempt to trigger resting stop orders, which then cause pre-placed orders to be executed at a profit by the ignited price movement.

Scoring methodology

To detect potential momentum ignition, TT Trade Surveillance searches for specific patterns of fill activity by the same trader who submitted the aggressive orders. It looks for traders who place multiple orders that immediately lift offers or hit bids within a short time frame (called aggressive orders). For each of these aggressive orders, TT Trade Surveillance identifies fill prices for orders executed at multiple price levels and whether the changing fill prices trend in same side as the aggressive orders. Finally, it determines whether a fill was received too quickly on the opposite side of the market from the aggressive orders.

Score interpretation

The score assigned is based on a sliding scale between 0-100, based on the relationship between the aggressive order fill quantities and the profit-taking order fill quantities.

Scorecard metrics

The Scorecard Metrics section measures the following statistics related to momentum ignition:

  • Ignitier Price Levels: Number of price levels at which the aggressive orders were filled. The sequence of price levels at which fills occur correspond to the movement in market price (i.e. Buy orders at increasing price levels that contribute to an increase in market price).
  • Ignites (Vol): Fill volume for the “aggressive” orders (bids that immediately lift offers or offers that immediately lift bids within) within a time frame.
  • Opp. Side (Vol): Volume of fills received on the opposite side of the market from the aggressive order within a time frame.

For example, if the Igniter Price Levels and the Ignites (Vol) metrics display large values, this indicates that the trader may have been attempting to ignite a price movement in a particular direction (buy or sell) in order to mislead other market participants or to create an artificial price. The Opp. Side (Vol) is a good indicator of whether or not the trader received advantageous fills on orders opposite the igniter orders that the trader would not have otherwise received without intentionally or recklessly sparking the price movement.

Identifying momentum ignition

When investigating Momentum Ignition clusters with TT Trade Surveillance, you should focus on the:

  • Number of distinct price levels used by aggressive orders.
  • Quantity filled on the aggressive orders.
  • Quantify filled on the opposite, or profit-taking, orders.

Use the Cluster Scorecard to get a closer look at the activity that triggered the high cluster score. The pressure chart on the scorecard provides visual clues about the potential suspect trading pattern. The order audit trail data on the scorecard can then be used to verify order information and timing of the activity. The following example shows trading activity identified as potential Momentum Ignition.
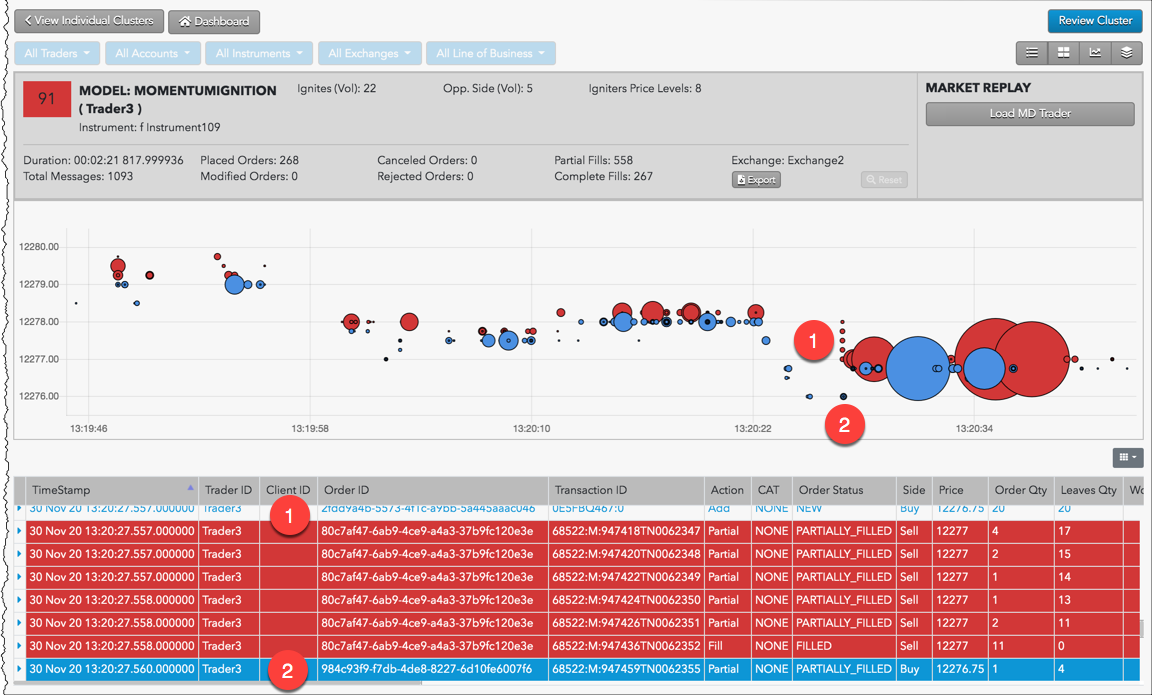
In this example:

  1. Multiple aggressive Sell orders are submitted and filled in a short time span at the best Bid price.
  2. The orders ignite a price movement and the same trader receives a Buy fill on the same side of the market.

The activity can then also be replayed on the Ladder view tool and viewed on the Macro view. For example, you can click Market Replay to show how the orders interacted with the market at the various price levels.
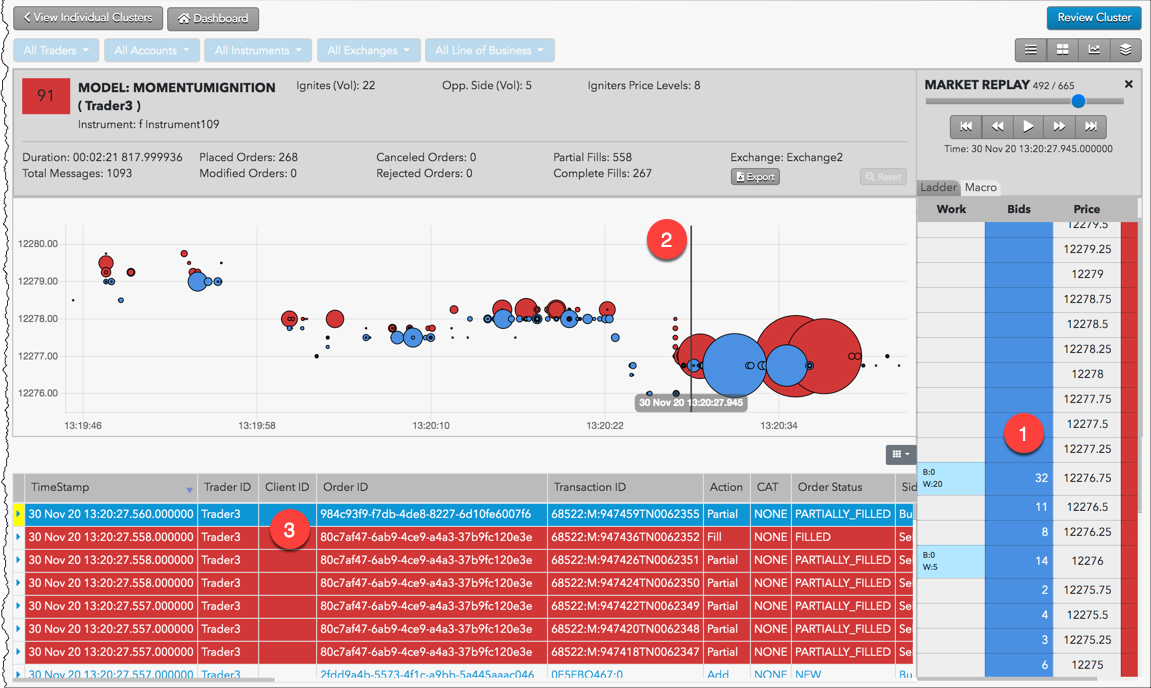
In this example:

  1. The price ladder shows the prices and liquidity in the market during the suspect trading activity.
  2. The vertical line identifies the point of time during the market replay.
  3. Orders and fills that occurred around the specified time during the market replay are shown in the audit trail.