Trade
Overview
TT Platform
Description
Task
Browser Access
Description
Task
Videos
TT Desktop
Description
Task
Videos
Reference
Workspace Windows
Description
Task
Videos
Widgets
Description
Task
Preferences
Description
Viewing Market Data
Time and Sales
Task
Reference
Description
Depth
Description
Task
Reference
Market Grid
Description
Task
Videos
Reference
Product Grid
Description
Task
Reference
Spread Matrix
Description
Task
Videos
Reference
Basic Order Entry
TT Order Types
Description
Task
Videos
Reference
Case Studies
TT Premium Order Types
Description
Task
Reference
Order Ticket
Description
Task
Use Cases
Reference
MD Trader®
Description
Task
Videos
Reference
Order Profiles
Description
Task
Reference
Routing Rules
Description
Task
Blocktrader
Description
Task
Videos
Reference
Trading Crypto on TT
Description
Task
Videos
Reference
Trading on B3
Order Management
Order Book
Description
Task
Reference
Floating Order Book
Description
Task
Reference
Fills
Description
Task
Reference
Positions
Description
Task
Reference
Orders and Fills
Description
Task
Reference
Audit Trail
Description
Task
Reference
Audit Query
Description
Task
Reference
Account List
Description
Task
Videos
Reference
Position Manager
Description
Task
Reference
Alert Manager and Alert Viewer
Description
Task
Videos
Reference
Account & User Restrictions
Description
Task
Reference
Balances
Description
Task
Reference
TT® OMS
Care Orders
Description
Task
Videos
Reference
Lock and Release
Description
Task
Bulking
Description
Task
Videos
Stitching and Splitting
Description
Task
Combining
Description
Task
Order Passing
Description
Task
Use Cases
Order Exceptions
Description
Task
Options
Options on TT
Description
Videos
Options Chain
Description
Task
Use Cases
Videos
Reference
Options Trade Monitor
Description
Task
Videos
Reference
Vol Curve Manager
Description
Task
Use Cases
Videos
Reference
Electronic Eye
Description
Task
Videos
Reference
RFQ Viewer
Description
Task
Videos
Reference
RFQ with Counterparties
Description
Task
Counterparty Manager
Description
Task
Strategy Creation
Description
Task
Use Cases
Reference
Options Risk
Description
Task
Videos
Reference
Options Risk Matrix
Description
Task
Videos
Reference
Watchlist
Description
Task
Videos
Reference
Expiration Manager
Description
Task
Volatility Calculator
Description
Task
TT Uncovered 2.0
Description
Task
TT Uncovered 3.0
Description
Task
QuikStrike
Description
Task
Spread Trading
Autospreader
Description
Task
Use Cases
Videos
Reference
Autospreader Rules
Description
Task
Videos
Reference
Hedge Manager
Description
Task
Videos
Reference
Trading in Yield
Description
Task
Use Cases
Reference
Aggregator
Description
Task
Videos
Reference
Algo Trading
Algo Dashboard
Description
Task
Videos
Reference
Template Manager
Description
Task
Order Management Algos (OMAs)
Autotrader
Description
Task
Reference
Videos
Excel integration with TT
Description
Task
Videos
Reference
Market-Making Algos
Analytics
Charts
Description
Technical Indicators
Task
Videos
Reference
Trader Analytics
Description
Task
Reference
ADL
ADL Overview
Introduction to ADL
Description
Task
Videos
Reference
ADL Basic Concepts
Description
Task
Reference
Building your first algo
Lessons
Advanced concepts
Description
Task
Case Studies
Jump blocks
Group blocks
Virtualized blocks
Library blocks
Trading Blocks
Discrete blocks
Arithmetic blocks
Basic blocks
Logic blocks
Miscellaneous blocks
Setup
Setup Overview
Getting Started
Description
Task
Videos
Reference
Supported Order Types and TIFs
Company Administration
Connections
Description
Task
Videos
Reference
Accounts
Description
Task
Videos
Use Cases
Reference
Users
Description
Task
Videos
Reference
Company
Description
Task
Reference
Order Tag Defaults
Description
Task
Account Administrators
Description
Task
TT Premium Services
Description
Task
TT Access
Description
Task
Advanced Features
Description
Risk Management
Risk Administration
Description
Task
Risk Limits
Description
Task
Videos
Reference
Pre-Trade Portfolio Risk
Description
Task
Reference
Order Cross Prevention
Description
Task
Videos
KRM Limits
Description
Task
TT® OMS
TT OMS Administration
Description
Task
Use Cases
Reference
Exchanges: Americas
B3
Description
Task
CBOE
Description
Task
Cboe FX
Description
Task
Reference
CFE
Description
Task
CME
Description
Task
Dealerweb
Description
Task
EBS Direct
Description
Task
EBS Market
Description
Task
Fenics
Description
Task
FMX
Description
Task
FMX_USTF
Description
Task
Goldman Sachs Commodity Blocks (GSCB)
Description
Task
Referece
ICE
Description
Task
MexDer
Description
Task
MIAX_FUT_CH
Description
Task
MIAX_FUT_NY
Description
Task
MX
Description
Task
Nodal
Description
Task
NFI
Task
Exchanges: EMEA
ATHEX
Description
Task
BIST
Description
Task
DGCX
Description
Task
EEX
Description
Task
EPEX SPOT
Description
Task
Reference
Eris
Description
Task
Eurex
Description
Task
Videos
Euronext
Description
Task
GFO-X
Description
Task
ICE_L
Description
Task
JSE
Description
Task
LME
Description
Task
LME NTP
Description
Task
LSE
Description
Task
MEFF
Description
Task
NDAQ_EU
Description
Task
NASDAQ_NED
Description
Task
Nord Pool
Description
Task
Reference
WSE
Description
Task
Exchanges: Asia/Pacific
ABX
Description
Task
ASX
Description
Task
FEX
Description
Task
HKEx
Description
Task
JPX
Description
Task
NSE
Description
Task
NZX
Description
Task
SGX
Description
Task
SGX GIFT
Description
Task
TAIFEX
Description
Task
TFEX
Description
Task
TFX
Description
Task
CoinFLEX
Task
Exchanges: Crypto
Coinbase
Description
Task
Kraken
Description
Task
FIX Support
FIX Ruleset
Description
Task
FIX Sessions
Description
Task
Secondary Accounts
Description
Task
Monitor
TT Mobile
TT Backtesting
APIs
TT REST API 2.0
Getting Started
API Reference
TT REST API 2.0 (UAT)
Getting Started
API Reference
TT .NET SDK
Getting started with TT .NET SDK
Creating the application framework
Working with instruments
Subscribing for market data
More about prices
An in-depth look at the Price class
Working with orders and fills
Handling trade subscriptions
Working with trade subscriptions
Working with Algos
Algo Server
TT Order Types
TT Premium Order Types
Advanced Concepts and Options
Appendix
TT CORE SDK
Getting Started with TT Core SDK
Creating Application Framework
Working With Instruments
Subscribing for Market Data
Working with Orders and Fills
Creating a TT Application Server
Appendix
TT Trade Surveillance
Overview
Using TT Trade Surveillance
Cluster View
Core Models
Market Abuse Models
Cross Product Models
Spoofing Models
Improperly Matched Trade Models
Market Rate Models
Trading Behaviors Models
Miscellaneous Models
Configurable Models
Reports
Wachlists
Reference
TT FIX Services
TT FIX General
Getting Started
FIX Message Structure
Session messages
TT FIX Order Routing
Overview
TT FIX message conversations
Supported application messages
TT FIX Market Data
Overview
TT FIX message conversations
Supported application messages
TT FIX Drop Copy Out
Overview
TT FIX Message Conversations
Supported application messages
Compliance Feed messages
TT FIX Drop Copy In
Overview
Supported application messages
TT FIX Gateway
Getting Started
FIX Message Structure
Components
Session messages
Price Gateway Messages
Order Gateway Messages
TT FIX Recovery
Overview
FIX Recovery Methods
Supported application messages
Compliance Feed Messages
MiFID II Support

Excessive Bid/Ask

On this page

The Excessive Bid/Ask model looks for when a single trader’s submitted orders make up the majority of the bid/ask volume of an instrument at different times during a trading session. The Excessive Bid/Ask model in TT Trade Surveillance uses the frequency and severity of Order Book Dominance (OBD) clusters generated for a trader/instrument combination to help determine if a trader is potentially exerting control over an instrument’s price by submitting a large number of bids and asks during the session.

When a single trader’s orders make up a large amount of the bid/ask volume for an instrument, this may indicate control over the pricing of that instrument. The Excessive Bid/Ask model can alert your firm to this behavior, which may be an indication of potential market manipulation.

Note: The Excessive Bid/Ask model only identifies potentially suspicious trading behavior. This model does not necessarily reflect an actual rule violation.

Scoring methodology

Higher scores indicate the trading activity within a cluster is more likely to risk regulatory concern. A company’s risk monitors can use these scores to prioritize resources for investing which users’ trading activity poses the most regulatory risk.

Excessive Bid/Ask score interpretation

The Excessive Bid/Ask model finds instances where the trader submits a high number of bids/asks relative to the session volume.

Each cluster is assigned a risk score on a sliding scale between 0-100. This score represents the probability that Excessive Bid/Ask occurred during the duration of the cluster’s trading activity.

Based on TT Trade Surveillance best practices, clusters that score over 75 are deemed to be “high risk” and should be the primary focus of users during their compliance reviews.

Excessive Bid/Ask scorecard metrics

The Scorecard Metrics section measures the following statistics related to identifying the excessive bid/ask submissions:

  • Session Vol — Total volume for the trading session.
  • Session Open — The instrument’s opening price for the session.
  • Session Close — The instrument’s closing price for the session./li>
  • Trader Vol — The trader’s total volume.
  • OBD Clusters — The number of identified order book dominance (OBD) clusters.
  • Avg OBD Score — The average order book dominance (OBD) score.
  • Avg OBD Buy Mkt Dom — The average order book dominance (OBD) score for the ‘buy’ side of the market.
  • Avg OBD Sell Mkt Dom — The average order book dominance (OBD) score for the ‘sell’ side of the market.
  • Avg OBD Top5 Buy Qty — The average quantity of the top 5 buy orders identified as order book dominant for the ‘buy’ side of the market.
  • Avg OBD Top5 Sell Qty — The average quantity of the top 5 buy orders identified as order book dominant for the ‘sell’ side of the market.
  • HighRsk OBD Clusters — The number of high-risk order book dominance clusters.
  • Avg HighRsk Score — The average high-risk score.
  • Avg HighRsk OBD Buy Mkt Dom — The average high-risk order book dominance (OBD) score for the ‘buy’ side of the market.
  • Avg HighRsk OBD Sell Mkt Dom — The average high-risk order book dominance (OBD) score for the ‘sell’ side of the market.
  • Avg HighRsk OBD Top5 Buy Qty — The average quantity of the top 5 buy orders identified as high-risk order book dominant for the ‘buy’ side of the market.
  • Avg HighRsk OBD Top5 Sell Qty — The average quantity of the top 5 buy orders identified as high-risk order book dominant for the ‘sell’ side of the market.
  • Ratio HighRsk Vs Total Clstrs — The ratio of clusters identified as high-risk to the total number of clusters.
  • Ticks Moved Open to Close — The total number of ticks which the instrument’s price moved between the opening and closing prices.
  • Price Pct Move Open to Close — The total percentage of change between the opening and closing prices.
  • MedRsk OBD Clusters —The number of medium-risk order book dominance clusters.
  • Avg MedRsk Score — The average medium-risk score.
  • Avg MedRsk OBD Buy Mkt Dom — The average medium-risk order book dominance (OBD) score for the ‘buy’ side of the market.
  • Avg MedRsk OBD Sell Mkt Dom — The average medium-risk order book dominance (OBD) score for the ‘sell’ side of the market.
  • Avg MedRsk OBD Top5 Buy Qty — The average quantity of the top 5 buy orders identified as medium-risk order book dominant for the ‘buy’ side of the market.
  • Avg MedRsk OBD Top5 Sell Qty — The average quantity of the top 5 buy orders identified as medium-risk order book dominant for the ‘sell’ side of the market.
  • LowRsk OBD Clusters — The number of low-risk order book dominance clusters.
  • Avg LowRsk Score — The average low-risk score.
  • Avg LowRsk OBD Buy Mkt Dom — The average low-risk order book dominance (OBD) score for the ‘buy’ side of the market.
  • Avg LowRsk OBD Sell Mkt Dom — The average low-risk order book dominance (OBD) score for the ‘sell’ side of the market.
  • Avg LowRsk OBD Top5 Buy Qty — The average quantity of the top 5 buy orders identified as low-risk order book dominant for the ‘buy’ side of the market.
  • Avg LowRsk OBD Top5 Sell Qty — The average quantity of the top 5 buy orders identified as low-risk order book dominant for the ‘sell’ side of the market.

Identifying Excessive Bid/Ask

Using the Cluster Scorecard, you can view the details of the activity that triggered the excessive bid/ask score.
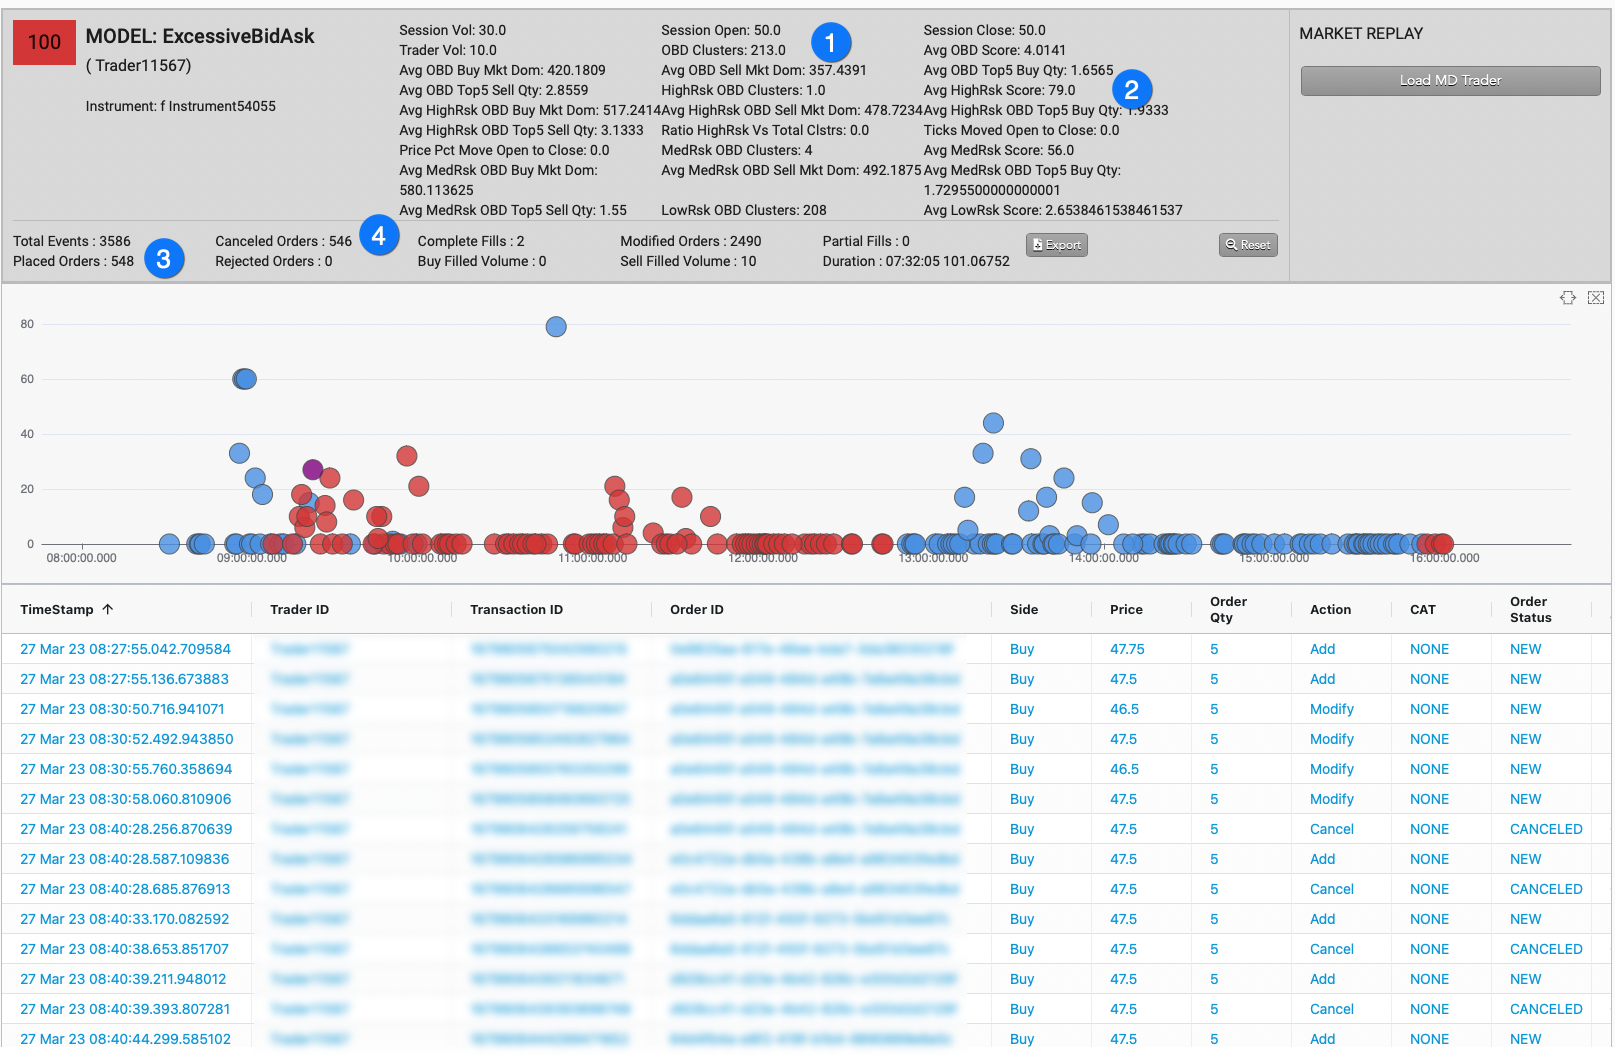
For example:

  1. The model identified a large number of OBD Clusters.
  2. A high value for the Avg HighRsk Score.
  3. A large percentage of the Placed Orders were submitted then deleted as shown by the high number of Canceled Orders.
  4. The Complete fills — metric is very low when compared to the total Placed Orders.