


Klinger Volume Oscillator, developed by Stephen Klinger, uses the key price compared to the prior bar’s key price to assign volume as positive or negative value.

Configuration Options
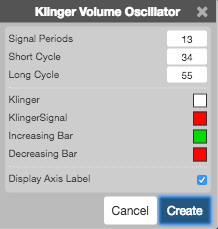
- Signal Periods: TBD
- Short Cycle: Number of periods to include in the short cyle.
- Long Cycle: Number of periods to include in the long cycle.
- Color Selectors: Colors to use for graph elements.
- Display Axis Label: Whether to display the most recent value on the Y axis.
Formula
\[Key\;Price_{t} = \frac{High_{t} + Low_{t} + Close_{t}}{3} \]
\[Key\;Price_{t-1} = \frac{High_{t-1} + Low_{t-1} + Close_{t-1}}{3} \]
\[ \text{Trend} = \begin{pmatrix} \text{if } \text{Key Price}_t > \text{Key Price}_{t-1}, \quad \text{Volume} \\ \text{if } \text{Key Price}_t < \text{Key Price}_{t-1}, \quad -\text{Volume} \end{pmatrix} \]
\[KVO = EMA_{short-period}(Trend) – EMA_{long-period}(Trend) \]
\[KVO\;Signal = EMA_{signal}(KVO)\]
where
\[EMA = exponential\;moving\;average\;of\;user\;defined\;lengths\;of\;short-period,\;long-period,\;and\;signal.\]