The Cluster Scorecard view provides a summary of the vital statistics of the cluster as well as an initial visualization of the pattern that was formed by the order and fill messages that comprised the cluster. You can also view the activity in the cluster in the context of the market data at the time.
Clicking the Inspect button in the Actions column of the Cluster List View opens the scorecard for the selected cluster.
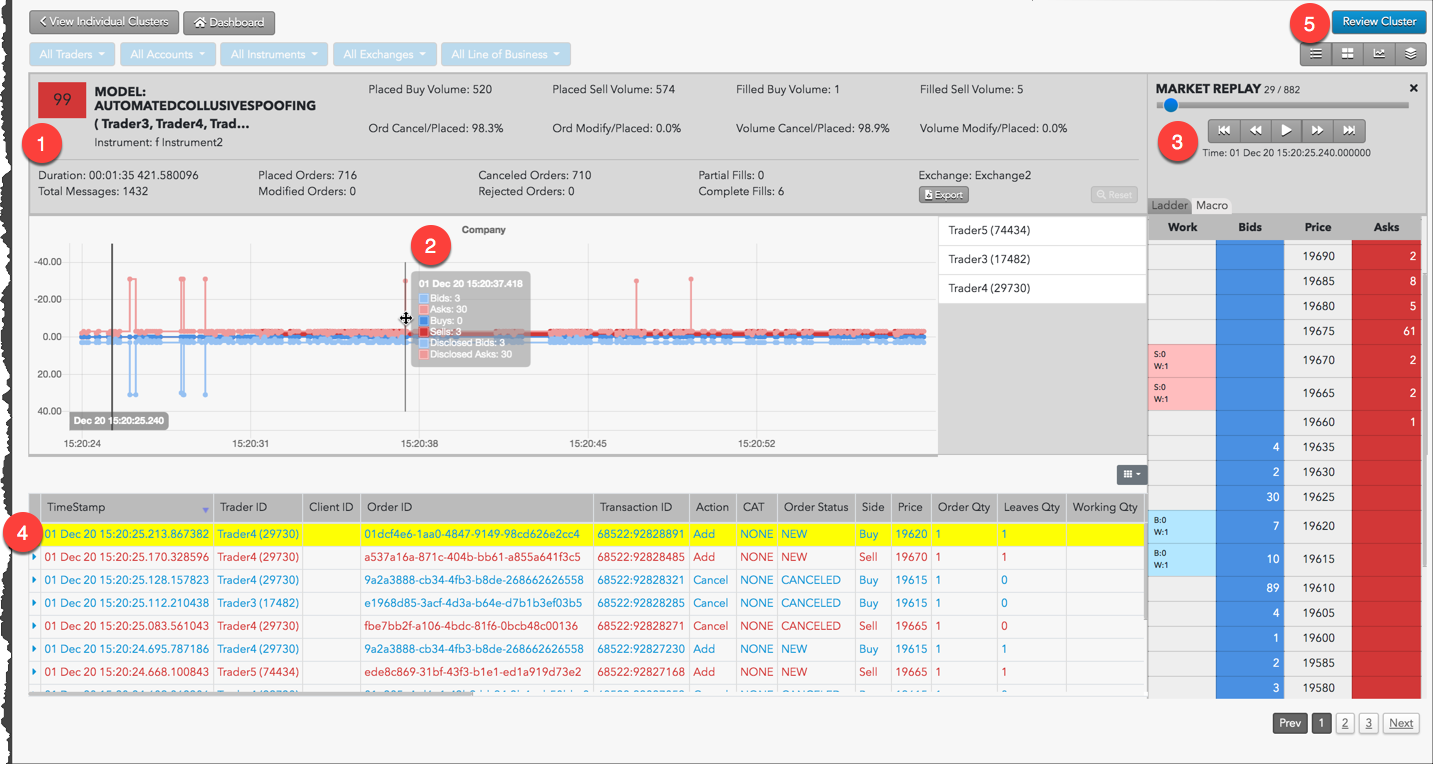
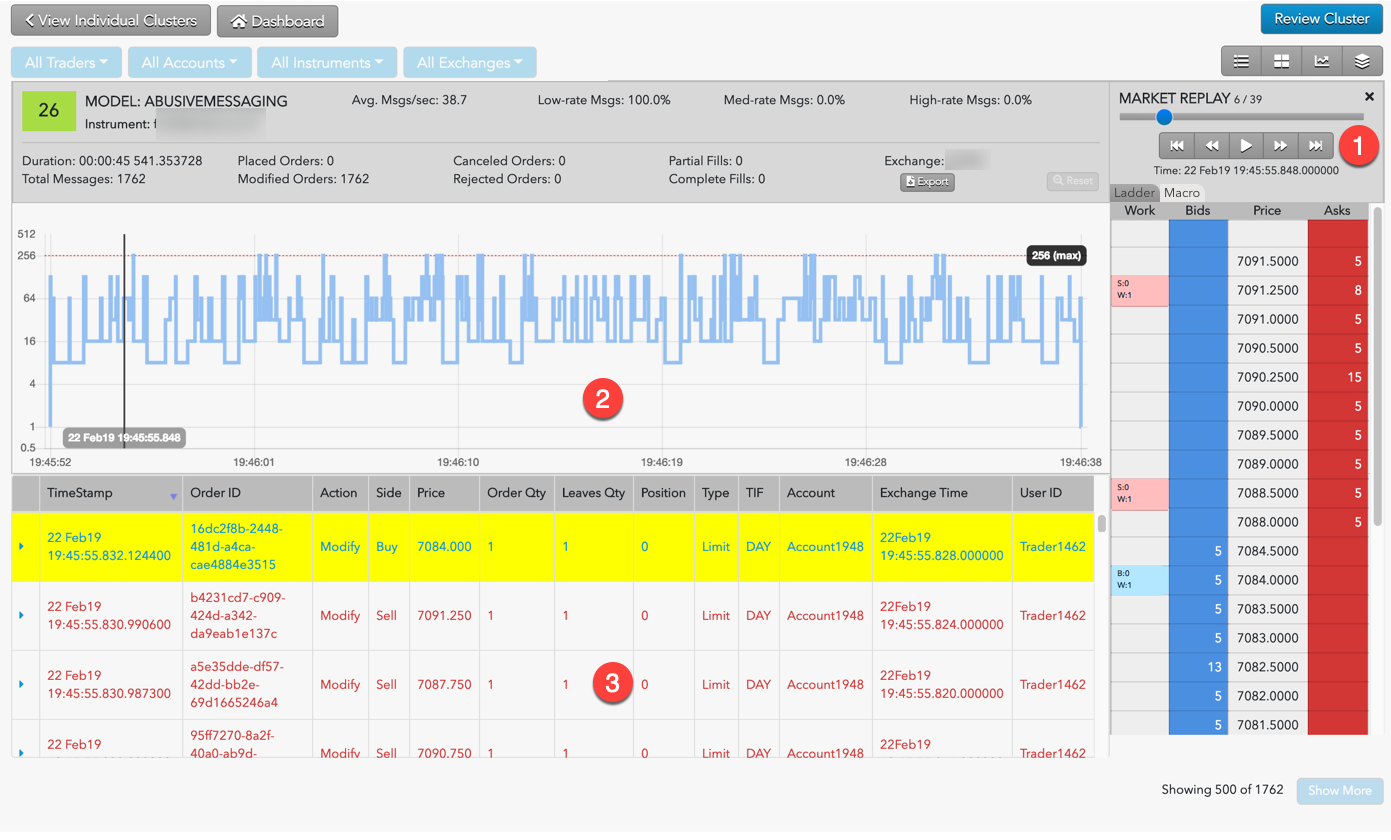
Cluster Scorecard display
The Cluster Scorecard is organized into the following sections.
Sections include:
- Cluster Statistics and Scorecard Metrics: Displays statistics and metrics for the trading activity analyzed within the cluster.
- Filled Positions and Working Orders: For the Spoofing model, displays the trading activity and volume of contracts traded within the cluster over a period of time. The trading details at each time interval is displayed when hovering over the chart. Note: The Abusive Messaging and Marking the Close models each have their own chart in the cluster scorecard.
- Market replay: Provides different time-based views of the trading activity overlaid with market data in a ladder view or a macro view.
- Audit Messages: Shows the actual order actions and fills from the audit trail. Rows are color coded by action and side. Click each row to display the order history or fill details.
- Review: Allows you to review a cluster.
Cluster statistics and scorecard metrics
The Cluster Statistics and Scorecard Metrics sections provide general information about the cluster as well as model-specific details.
The lower part of the Cluster Statistics section includes summary details about the cluster. Click the down arrow ![]() to the right of the score to expand the statistics.
to the right of the score to expand the statistics.
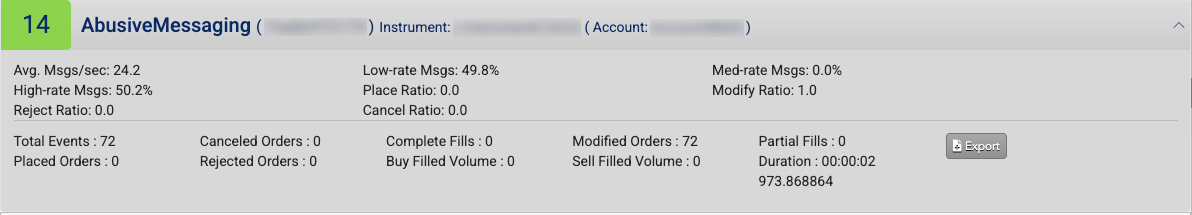
Statistics include:
- Total Events: Total number of messages sent and received
- Placed Orders: Number of orders submitted
- Canceled Orders: Number of orders canceled
- Partial Fills: Number of partial fills received
- Modified Orders: Number of order modified
- Complete Fills: Number of fully-filled orders
- Rejected Orders: Number of order rejected
- Buy Filled Volume: Number of Buy contracts traded
- Sell Filled Volume: Number of Sell contracts traded
- Duration: Length of time covered by the cluster
The Scorecard Metrics section shows model-specific information.
TT Trade Surveillance uses the following models to analyze data for problematic trading patterns:
- Abusive Messaging: Quote stuffing schemes designed to introduce predictable latency into an exchange’s quoting engine or malfunctioning algorithms that might cause market disruptions.
- Automated Collusive Spoofing: Patterns of manipulative or disruptive trading activity by multiple traders working together to automatically submit a number of orders for which they have no intention of executing in an attempt to move the market.
- Automated Spoofing: Patterns of manipulative or disruptive trading activity that involve the automated placement of a number of orders for which a trader has no intention of executing in an attempt to move the market.
- Collusive Spoofing: Patterns of manipulative or disruptive trading activity by multiple traders working together to place a number of orders for which they have no intention of executing in an attempt to move the market.
- Configurable Models: In addition to core models, TT Trade Surveillance offers configurable models that allow you to create models to generate alerts when activity matches the specified parameters.
- Cross Products: Patterns of suspicious trader behavior across instruments, products and markets. The clusters identify activity between multiple traders across different configured products.
- Cross Trading: A cross trade occurs when a buy order and a sell order for the same instrument are entered for different accounts under the same management, such as a broker or portfolio manager.
- Exchange Messaging Rate Limits: Instances where traders exceeded the exchange message rate limit for a set period of time during a trading session.
- Influencing the Open: Instances where indirect wash trades occurred at the open of trading in violation of exchange rules.
- Marking the Close: Trading activity intended to manipulate the settlement price of an instrument during its settlement period.
- Momentum Ignition: Behaviors that indicate an attempt to create an artificial price movement with aggressive orders followed by an attempt to capitalize on such movement.
- Pinging: The entry of multiple small orders intended to discover hidden book depth followed by a series of order actions designed to force the large order to trade at less desirable prices.
- Price Ramping: Behavior that may be an attempt to create artificial price movement with aggressive orders.
- Spoofing: Patterns of manipulative or disruptive trading activity that involve the placement of a number of orders for which a trader has no intention of executing in an attempt to move the market.
- Wash Account: The same account ID is both the buyer and seller in the same transaction.
- Wash Trader: The same trader ID is both the buyer and seller in the same transaction.
- Dominance at Open: A single trader’s orders make up the majority of the disclosed market volume of an instrument during the first 15 minutes of the current trading session.
- Order Book Dominance: A single trader’s working orders make up the majority of the disclosed market volume of an instrument at any time during a trading session.
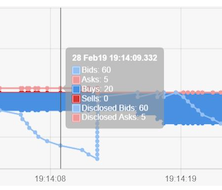
Filled positions and working orders
The Spoofing chart shows the buys and sells (working and filled) along with Iceberg (disclosed) volume and markers when the trader is flipping the market.
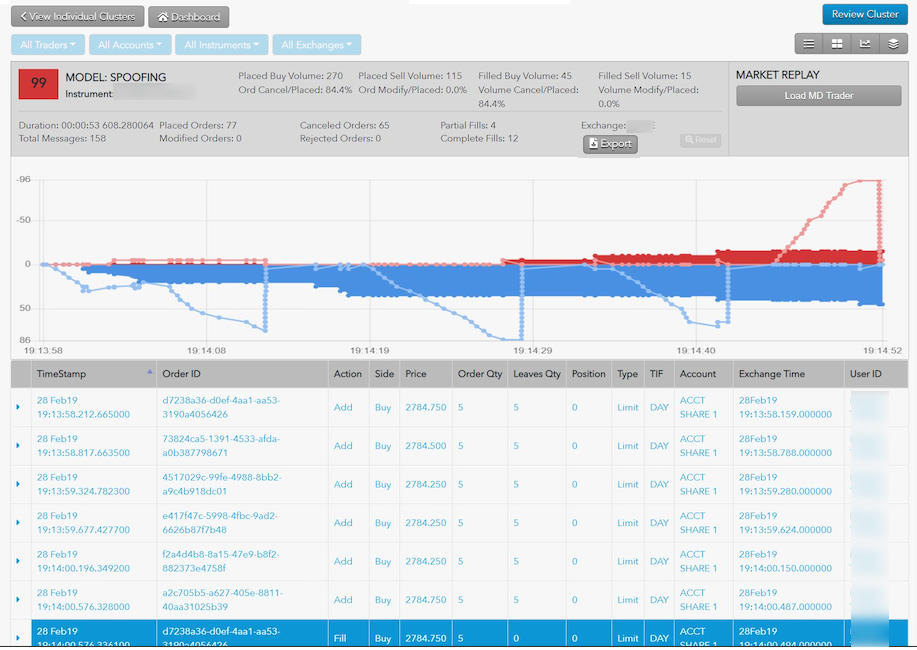
You can hover the mouse over a spot the chart to view the trading details in the audit trail.
Audit trail
This section shows the actual order actions from the audit trail with some minor normalization of things like Order Type, Side and Order Action. Rows are color coded by action and side. Click the column selector ( ) above the audit trail to show additional columns.
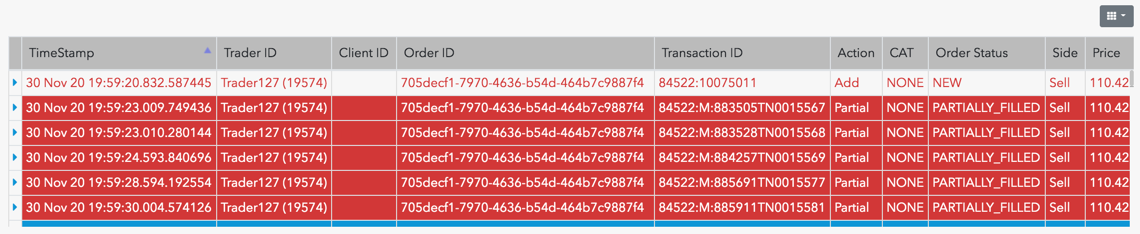
Audit fields are described in the following table.
| Field | Description |
|---|---|
| Timestamp | Date and time the order was submitted. |
| Order ID | Unique TT order ID for internal tracking. |
| Transaction ID | The transaction identifier generated by and received from the Exchange. |
| Action | Type of order or fill action on the execution report. |
| Side | The side of trade (Buy or Sell). |
| Price | Order price |
| Order Qty | Order quantity |
| Leaves Qty | Remaining order quantity |
| Position | The user’s position. Positive numbers indicate a long position. Negative numbers indicate a short position. |
| Type | The order type. Supported order types vary by exchange. |
| TIF | The order Time-In-Force restriction. Supported TIFs vary by exchange. |
| Account | Account ID associated with the order. |
| Exchanges Time | For messages going to the exchange, this represents when the message is sent to the exchange from the order server. For messages received from the exchange, this represents when the message is sent from the order server to the rest of the TT platform. |
| Exch ID | Exchange defined execution identifier. |
| Order ID | Unique TT order ID for internal tracking. |
| User ID | The TT platform user identifier. |
| CAT | Crossing Action Type |
| Modifier | The modifier applied to the order. Example: Stop, If Touched, Trailing Stop, Trailing IT, Trailing Limit, Machine Gun |
| Order Status | State of the order on the execution report. |
| Working Quantity | The total order quantity working in the market. |
| Modifier | The modifier applied to the order. Example: Stop, If Touched, Trailing Stop, Trailing IT, Trailing Limit, Machine Gun |
| Agressorindicator | Indicates an aggressive order: true or false. |
| Parent ID | Parent order identifier. |
| CustOrderCapacity/td> | The FIX Tag 1031 value on the order message. |
| ManualOrderIndicator/td> | Indication of manual or automated order entry. Sent to the exchange in FIX Tag 1028. |
| AvgPx | Average price of the filled order. |
| BrokerId | Identifier of the broker submitting the order. |
| RefreshQty | The amount to refresh the displayed quantity at the exchange, typically set on Iceberg orders. |
| Source | Shows where the order originated from. |
| TrdMatchId | The user’s trade match prevention identifier. |
| Exec Type | Type of order or fill action on the execution report. |
| DisplayQty | The amount of the order to be publicly displayed at the exchange, typically set on iceberg orders. |
| LastQty | The amount filled on the order. |
| CumQty | The total quantity filled. |
| MinQty | The minimum quantity to be executed. |
| TradeType | The type of trade submitted. |
| AlgoId | For TT synthetic and algorithm orders, the identifier of the algorithm controlling the order. |
| CrossId | Self match prevention identifier provided by the exchange. |
| CurrUserId | identifier of the user who last touched an orders. |
| ExecInst | Execution instruction. |
| StopPx | Price at which price-triggered orders were executed. |
| SenderSubId | Identifier of the user submitting the trade. Value of FIX Tag 50. |
| AccountOverride | Account sent to the exchange as the clearing account. |
| EchoDc1 | Customer-defined text field that can be populated by FIX client applications. The value is not sent to the exchange, but remains visible in TT. |
| EchoDc10 | Customer-defined text field that can be populated by FIX client applications. The value is not sent to the exchange, but remains visible in TT. |
| EchoDc2 | Customer-defined text field that can be populated by FIX client applications. The value is not sent to the exchange, but remains visible in TT. |
| EchoDc3 | Customer-defined text field that can be populated by FIX client applications. The value is not sent to the exchange, but remains visible in TT. |
| EchoDc4 | Customer-defined text field that can be populated by FIX client applications. The value is not sent to the exchange, but remains visible in TT. |
| EchoDc5 | Customer-defined text field that can be populated by FIX client applications. The value is not sent to the exchange, but remains visible in TT. |
| EchoDc6 | Customer-defined text field that can be populated by FIX client applications. The value is not sent to the exchange, but remains visible in TT. |
| EchoDc7 | Customer-defined text field that can be populated by FIX client applications. The value is not sent to the exchange, but remains visible in TT. |
| EchoDc8 | Customer-defined text field that can be populated by FIX client applications. The value is not sent to the exchange, but remains visible in TT. |
| EchoDc9 | Customer-defined text field that can be populated by FIX client applications. The value is not sent to the exchange, but remains visible in TT. |
| Giveup | The giveup party account. |
| LastPx | Price of this fill. |
| LegCumQty | The total quantity filled for the leg. |
| OmaParentOrderId | Unique TT Order ID for an OMA parent order. |
| OrdRejReason | Reason the order was rejected at the exchange. |
| OrderOrigination | Identifies the origin of the order. |
| OrderSequence | Order message sequence number. |
| SecondaryExecId | Unique TT execution ID for the execution type. |
| SecondaryOrderId | Identifier for the party accepting the order. |
| SyntheticType | Type of synthetic parent order. |
| TextA | Optional, user-defined text value. Remains on the order in the TT system. |
| TextB | Optional, user-defined text value. Remains on the order in the TT system. |
| TextC | Read-only, customer-defined text value set by FIX client applications. The value is not sent to the exchange. |
| Text | Optional, user-defined text value. Remains on submitted orders for tracking purposes in the TT system, but is not routed to the exchange. |
Order history
You can view the life cycle of a selected order in your cluster by clicking an order event row in the Audit Messages section. The order history appears under displays beneath the selected order.
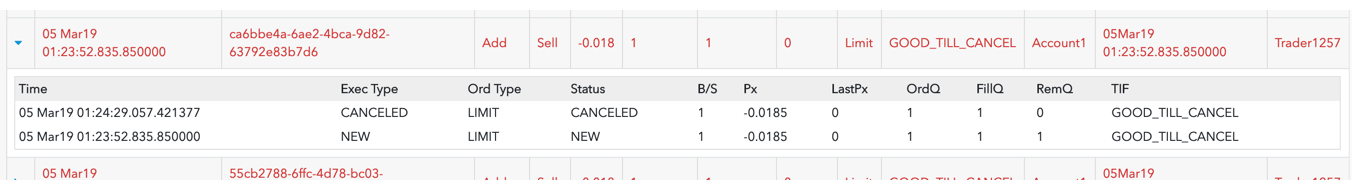
This order history includes the following columns:
| Field | Description |
|---|---|
| Time | Date and time the order was submitted. |
| Exch | Exchange defined execution identifier. |
| Exec Type | Type of order or fill action on the execution report. |
| Order Type | The order type. Supported order types vary by exchange. |
| Order Status | The order status at the exchange. |
| Order ID | Unique TT order ID for internal tracking. |
| B/S | The side of trade (Buy or Sell). |
| Price | The order price. |
| Last Price | The last traded price. |
| OrdQty | Order quantity |
| FillQty | Filled Order quantity |
| RemQty | Remaining order quantity |
| TIF | The order Time-In-Force restriction. Supported TIFs vary by exchange. |
| Acct | Account used to submit the order. |
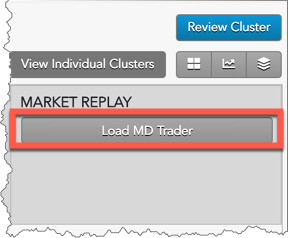
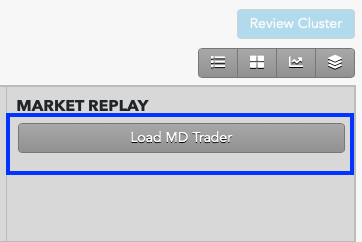
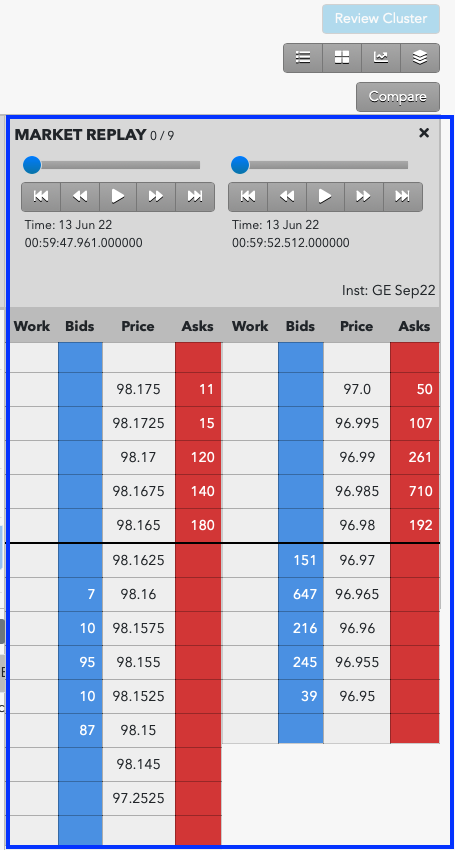
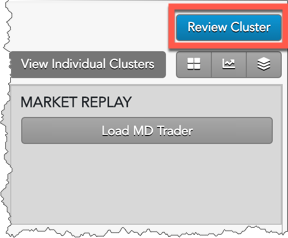
Market Replay
The Market Replay section of the Cluster Scorecard lets users view the cluster data overlaid on the market data as it occurred over time. Click Load MD Trader to display the market replay ladder and playback controls.
Users can display the replay data with the following views:
- Ladder view: Replays the market activity in a ladder-like interface as it occurred during the time period covered by the cluster.
- Dual Ladder view: Allows viewing market activity in a second instrument to access potential trading impact.
Ladder view
The Ladder view is a research tool that provides users with a frame-by-frame replay of the trading activity overlaid with Level 2 market data on a ladder-style interface. The ladder is 10 ticks deep and displays all market data, including the orders for each relevant participant in the order book. Users can stop, start and rewind the playback of the activity within a given cluster in order to gain a precise understanding of the sequence of events that occurred in the order book and how the trader’s orders impacted the market.
The ladder view includes the following:
- Interactive display of the market ladder for the specified time frame.
- Graph of trading activity showing buy and sell orders along with a bar indicating the current time in the replay.
- List of Audit Trail messages that comprise the activity included in the Market Replay.
Click Play to watch the market react as the order activity in the audit messages are replayed. As the market replays, a vertical bar tracks the progress in the graph and the audit messages are added as they occur. The Audit Message section lists the history of every audit message generated from the start of the replay to the current point in time of the market replay. You can start, stop and rewind the activity to help get a clearer picture of potentially problematic trading activity.
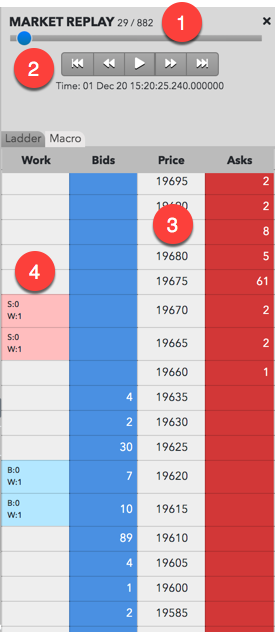
The market replay includes the following:
- Total number of frames in the replay and the frame number currently being displayed.
- Interactive controls to play and rewind trading activity in the ladder.
- Price ladder and state of the market at the indicated time.
- The trader’s working, displayed, undisclosed, and filled quantity at a price level.
Working order display in the Ladder view
When working orders are shown in the market replay, the corresponding cell in the working orders Work column contains abbreviations and colors to assist you in tracking and managing your working orders. The text and colors vary based on order type and order status. Refer to the following table for a description of the abbreviations and colors that appear in the working orders column.
|
Work Column Display |
Description |
|---|---|
|
|
Appears for working buy or sell orders. The cell is highlighted blue for buy orders, red for sell orders or yellow when the price level contains both buy and sell orders. Abbreviations include:
|
|
|
Appears when TT order types (e.g., TT Time Sliced) or native order types (Iceberg) with disclosed and undisclosed quantities were submitted. The cell is highlighted blue for buy orders, red for sell orders or yellow when the price level contains both buy and sell orders. Abbreviations include:
|


Dual Ladder View
The Dual Ladder View allows users to compare and view a related instrument in a second ladder in addition to the ladder from any Trade Surveillance cluster. When enabled, users can view the trader’s activity in the cluster specific instrument while loading any instrument in a second ladder.
The second ladder displays market activity that occurs at the same time as the first ladder. This allows you to review the potential market impact of the trader’s activity in a similar, related product, or to demonstrate that the user’s activity in the cluster was due to a change in market conditions in a separate instrument.
To view a second instrument in Dual Ladder View:
- Open the cluster you wish to review and click the Load MD Trader button.
- Above the MD Trader, click the Compare button.
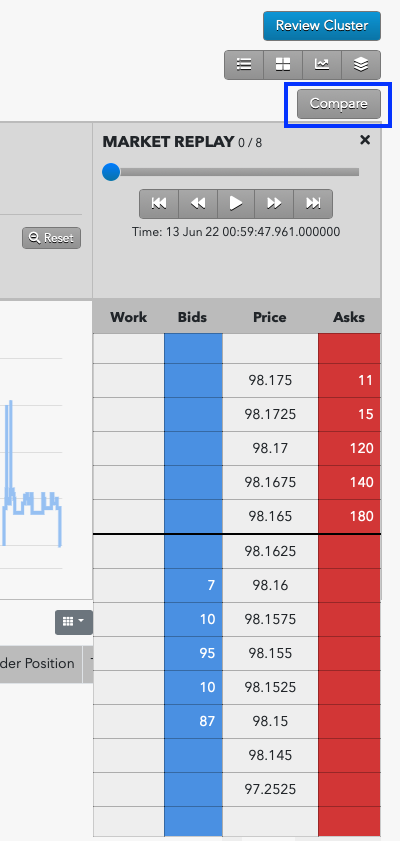
- A Market Explorer window opens allowing you to find and select the product you wish to compare.Note: You must have market data enabled for the exchange and products you want to compare.

- Press the Select Instrument button. The second ladder appears showing market data from the new instrument.
Cluster scorecard review
The scorecard contains a Review button that launches the Review Sidebar for recording dispositions, viewing disposition history, and opening investigations.
Cluster review
From within the Review Sidebar you can:
- Enter a disposition for this cluster group.
- View the review history for this cluster group
- Add this cluster to an existing investigation or create a new investigation to which to add this cluster.

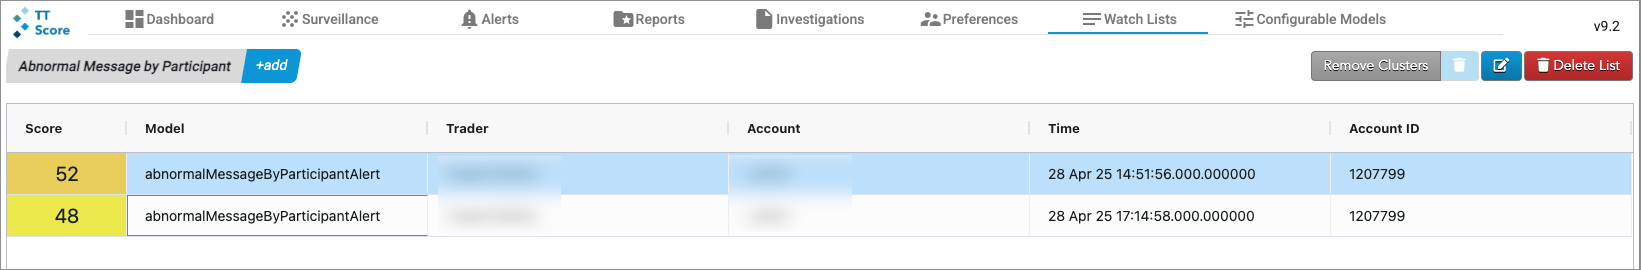
Watch Lists

You can create custom Watch Lists for monitoring potentially significant clusters that might not necessitate immediate action. These Watch Lists can also be used to track longer-term patterns in cluster generation.
In the Watch Lists tab, you can create, edit, and delete multiple watch lists at any time using the buttons located in the upper-right corner. After creating Watch Lists, you can add clusters to them in the Cluster View or the Cluster Scorecard View.
Adding Clusters to Watch Lists from the Cluster Scorecard View
Note You must create at least one Watch List before any clusters can be added.
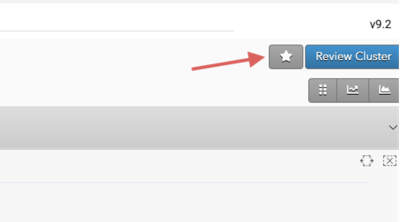
To add clusters to Watch Lists from the Cluster Scorecard View:
- In the Cluster Scorecard View, click the star in the upper-right corner.
- In the drop-down, select which list to add the selected cluster(s) to:
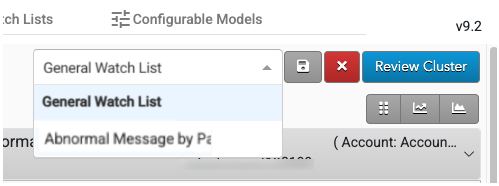
The clusters display in the selected Watch List’s tab.