


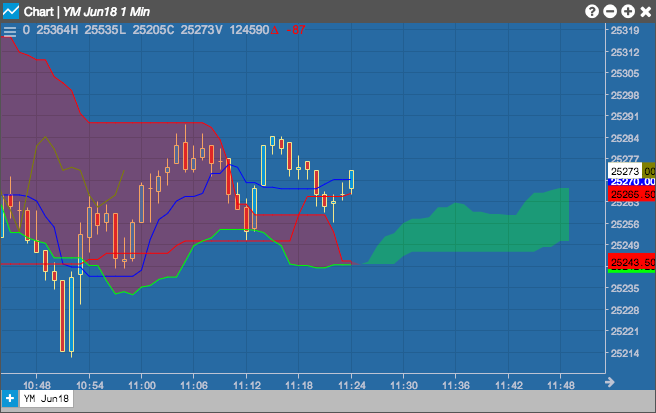
The Ichimoku Clouds study was developed by Goichi Hosoda pre-World War II as a forecasting model for financial markets. The study is a trend following indicator that identifies mid-points of historical highs and lows at different lengths of time and generates trading signals similar to that of moving averages or MACD. A key difference between Ichimoku and moving averages is Ichimoku charts lines are shifted forward in time creating wider support/resistance areas mitigating the risk of false breakouts.
The area between the two span lines forms the cloud. It is a thicker version of normal support and resistance lines that takes volatility into account. A break through the cloud and a subsequent move above or below it can indicate that the trend will continue in that direction.
Configuration Options
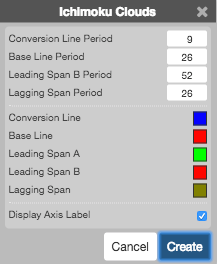
- Conversion Line Period: Number of periods to use for the conversion line calculations.
- Base Line Period: Number of periods to use for the base line calculations.
- Leading Span B Period: Number of periods to use for the leading span calculations.
- Laggins Span Period: Number of periods to use for the lagging line calculations.
- Color Selectors: Colors to use for graph elements.
- Display Axis Label: Whether to display the most recent value on the Y axis.
Formula
[Conversion;Line = frac{( Highest High_{cl-periods} + Lowest Low_{cl-periods} )}{2};for;the;past;cl-periods]
[Base;Line = frac{( Highest High_{bl-periods} + Lowest Low_{bl-periods} )}{2};for;the;past;bl-periods]
[Leading;Span;A = frac{( Base;Line + Conversion;Line )}{2} ;plotted;n-periods;ahead;of;the;current;bar]
[Leading;Span;B = frac{( Highest High + Lowest Low )}{2}; for;the;past;b-periods,;plotted ;m-periods;ahead;of;current;bar]
[Cloud = Shaded;Area;between;Span;A;and;Span;B]
[Lagging;Span = EMA_{x};plotted; frac{x}{2} ;periods;behind]