Charts
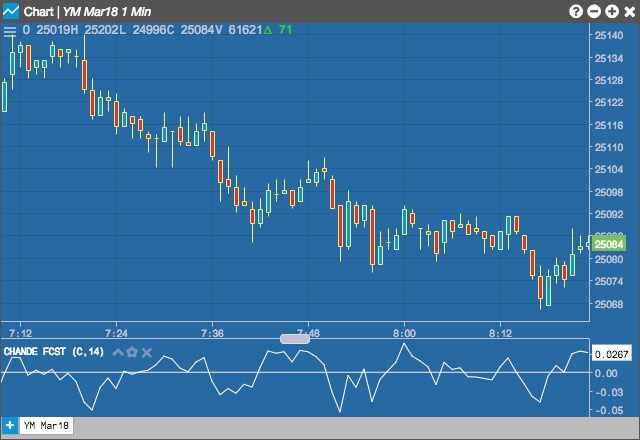
Chande Forecast Oscillator (CFO)
The Chande Forecast Oscillator plots the percentage difference between the closing price and the n-period linear regression forecasted price. The oscillator is above zero when the forecast price is greater than the closing price and less than zero if it is below.
Configuration Options
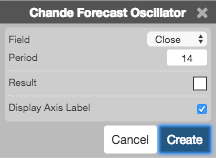
- Field: Price or combination of prices to use as the base for average calculations. Possible values include:
- Open
- High
- Low
- Close
- Adjusted Close
- HL/2 \( \left ( \frac{High + Low}{2} \right ) \)
- HLC/3 \( \left ( \frac{High + Low + Close}{3} \right ) \)
- HLCC/4 \( \left ( \frac{High + Low + Close + Close}{4} \right ) \)
- OHLC/4 \( \left ( \frac{Open + High + Low + Close}{4} \right ) \)
- Period: Number of bars to use in the calculations.
- Color Selectors: Colors to use for graph elements.
- Display Axis Label: Whether to display the most recent value on the Y axis.
Formula
\[CFO_{i} = \frac{(Close_{i} - Linear\;Regression)\times 100}{Close_{i}} \]
where linear regresion is calcualted as
\[slope\;=\;m\;=\;\frac{\sum_{i=1}^{n}(x_{i} - \bar{x})(y_{i} - \bar{y})}{\sum_{i=1}^{n}(x_{i} - \bar{x})^{2}}\]
\[intercept\;=\;b\;=\;\bar{y} - m\bar{x}\]