Trade
Overview
TT Platform
Description
Task
Browser Access
Description
Task
Videos
TT Desktop
Description
Task
Videos
Reference
Workspace Windows
Description
Task
Videos
Widgets
Description
Task
Preferences
Description
Viewing Market Data
Time and Sales
Task
Reference
Description
Depth
Description
Task
Reference
Market Grid
Description
Task
Videos
Reference
Product Grid
Description
Task
Reference
Spread Matrix
Description
Task
Videos
Reference
Basic Order Entry
TT Order Types
Description
Task
Videos
Reference
Case Studies
TT Premium Order Types
Description
Task
Reference
Order Ticket
Description
Task
Use Cases
Reference
MD Trader®
Description
Task
Videos
Reference
Order Profiles
Description
Task
Reference
Routing Rules
Description
Task
Blocktrader
Description
Task
Videos
Reference
Trading Crypto on TT
Description
Task
Videos
Reference
Trading on B3
Order Management
Order Book
Description
Task
Reference
Floating Order Book
Description
Task
Reference
Fills
Description
Task
Reference
Positions
Description
Task
Reference
Orders and Fills
Description
Task
Reference
Audit Trail
Description
Task
Reference
Audit Query
Description
Task
Reference
Account List
Description
Task
Videos
Reference
Position Manager
Description
Task
Reference
Alert Manager and Alert Viewer
Description
Task
Videos
Reference
Account & User Restrictions
Description
Task
Reference
Balances
Description
Task
Reference
TT® OMS
Care Orders
Description
Task
Videos
Reference
Lock and Release
Description
Task
Bulking
Description
Task
Videos
Stitching and Splitting
Description
Task
Combining
Description
Task
Order Passing
Description
Task
Use Cases
Order Exceptions
Description
Task
Options
Options on TT
Description
Videos
Options Chain
Description
Task
Use Cases
Videos
Reference
Options Trade Monitor
Description
Task
Videos
Reference
Vol Curve Manager
Description
Task
Use Cases
Videos
Reference
Electronic Eye
Description
Task
Videos
Reference
RFQ Viewer
Description
Task
Videos
Reference
RFQ with Counterparties
Description
Task
Counterparty Manager
Description
Task
Strategy Creation
Description
Task
Use Cases
Reference
Options Risk
Description
Task
Videos
Reference
Options Risk Matrix
Description
Task
Videos
Reference
Watchlist
Description
Task
Videos
Reference
Expiration Manager
Description
Task
Volatility Calculator
Description
Task
TT Uncovered 2.0
Description
Task
TT Uncovered 3.0
Description
Task
QuikStrike
Description
Task
Spread Trading
Autospreader
Description
Task
Use Cases
Videos
Reference
Autospreader Rules
Description
Task
Videos
Reference
Hedge Manager
Description
Task
Videos
Reference
Trading in Yield
Description
Task
Use Cases
Reference
Aggregator
Description
Task
Videos
Reference
Algo Trading
Algo Dashboard
Description
Task
Videos
Reference
Template Manager
Description
Task
Order Management Algos (OMAs)
Autotrader
Description
Task
Reference
Videos
Excel integration with TT
Description
Task
Videos
Reference
Market-Making Algos
Analytics
Charts
Description
Technical Indicators
Task
Videos
Reference
Trader Analytics
Description
Task
Reference
ADL
ADL Overview
Introduction to ADL
Description
Task
Videos
Reference
ADL Basic Concepts
Description
Task
Reference
Building your first algo
Lessons
Advanced concepts
Description
Task
Case Studies
Jump blocks
Group blocks
Virtualized blocks
Library blocks
Trading Blocks
Discrete blocks
Arithmetic blocks
Basic blocks
Logic blocks
Miscellaneous blocks
Setup
Setup Overview
Getting Started
Description
Task
Videos
Reference
Supported Order Types and TIFs
Company Administration
Connections
Description
Task
Videos
Reference
Accounts
Description
Task
Videos
Use Cases
Reference
Users
Description
Task
Videos
Reference
Company
Description
Task
Reference
Order Tag Defaults
Description
Task
Account Administrators
Description
Task
TT Premium Services
Description
Task
TT Access
Description
Task
Advanced Features
Description
Risk Management
Risk Administration
Description
Task
Risk Limits
Description
Task
Videos
Reference
Pre-Trade Portfolio Risk
Description
Task
Reference
Order Cross Prevention
Description
Task
Videos
KRM Limits
Description
Task
TT® OMS
TT OMS Administration
Description
Task
Use Cases
Reference
Exchanges: Americas
B3
Description
Task
CBOE
Description
Task
Cboe FX
Description
Task
Reference
CFE
Description
Task
CME
Description
Task
Dealerweb
Description
Task
EBS Direct
Description
Task
EBS Market
Description
Task
Fenics
Description
Task
FMX
Description
Task
FMX_USTF
Description
Task
Goldman Sachs Commodity Blocks (GSCB)
Description
Task
Referece
ICE
Description
Task
MexDer
Description
Task
MIAX_FUT_CH
Description
Task
MIAX_FUT_NY
Description
Task
MX
Description
Task
Nodal
Description
Task
NFI
Task
Exchanges: EMEA
ATHEX
Description
Task
BIST
Description
Task
DGCX
Description
Task
EEX
Description
Task
EPEX SPOT
Description
Task
Reference
Eris
Description
Task
Eurex
Description
Task
Videos
Euronext
Description
Task
GFO-X
Description
Task
ICE_L
Description
Task
JSE
Description
Task
LME
Description
Task
LME NTP
Description
Task
LSE
Description
Task
MEFF
Description
Task
NDAQ_EU
Description
Task
NASDAQ_NED
Description
Task
Nord Pool
Description
Task
Reference
WSE
Description
Task
Exchanges: Asia/Pacific
ABX
Description
Task
ASX
Description
Task
FEX
Description
Task
HKEx
Description
Task
JPX
Description
Task
NSE
Description
Task
NZX
Description
Task
SGX
Description
Task
SGX GIFT
Description
Task
TAIFEX
Description
Task
TFEX
Description
Task
TFX
Description
Task
CoinFLEX
Task
Exchanges: Crypto
Coinbase
Description
Task
Kraken
Description
Task
FIX Support
FIX Ruleset
Description
Task
FIX Sessions
Description
Task
Secondary Accounts
Description
Task
Monitor
TT Mobile
TT Backtesting
APIs
TT REST API 2.0
Getting Started
API Reference
TT REST API 2.0 (UAT)
Getting Started
API Reference
TT .NET SDK
Getting started with TT .NET SDK
Creating the application framework
Working with instruments
Subscribing for market data
More about prices
An in-depth look at the Price class
Working with orders and fills
Handling trade subscriptions
Working with trade subscriptions
Working with Algos
Algo Server
TT Order Types
TT Premium Order Types
Advanced Concepts and Options
Appendix
TT CORE SDK
Getting Started with TT Core SDK
Creating Application Framework
Working With Instruments
Subscribing for Market Data
Working with Orders and Fills
Creating a TT Application Server
Appendix
TT Trade Surveillance
Overview
Using TT Trade Surveillance
Cluster View
Core Models
Market Abuse Models
Cross Product Models
Spoofing Models
Improperly Matched Trade Models
Market Rate Models
Trading Behaviors Models
Miscellaneous Models
Configurable Models
Reports
Wachlists
Reference
TT FIX Services
TT FIX General
Getting Started
FIX Message Structure
Session messages
TT FIX Order Routing
Overview
TT FIX message conversations
Supported application messages
TT FIX Market Data
Overview
TT FIX message conversations
Supported application messages
TT FIX Drop Copy Out
Overview
TT FIX Message Conversations
Supported application messages
Compliance Feed messages
TT FIX Drop Copy In
Overview
Supported application messages
TT FIX Gateway
Getting Started
FIX Message Structure
Components
Session messages
Price Gateway Messages
Order Gateway Messages
TT FIX Recovery
Overview
FIX Recovery Methods
Supported application messages
Compliance Feed Messages
MiFID II Support

Marking the Close

On this page

Marking the Close is a pattern of trading activity intended to manipulate the settlement price of an instrument during its settlement period. The Marking the Close beta model in TT Trade Surveillance detects potential settlement price manipulation in select CME outrights and spreads, and identifies on-exchange activity during settlement periods that may have influenced the settlement price for the most commonly traded CME products.

Note: TT Trade Surveillance highlights suspicious trading for both spreads and outrights in the same product. Some multileg instruments can impact the settlement price of its outrights depending on the type of instrument or the expiration months involved.

Scoring methodology

To detect a trader’s potential Marking the Close trading activity, TT Trade Surveillance analyzes the following data during the settlement period:

  • The price of an instrument before settlement and its eventual settlement price.
  • Orders that comprise a large percentage of orders in the market.
  • Trades that occurred mostly on the same side of the market.
  • A trader’s activity during the settlement period in proportion to their activity during the entire trading session.
    • The model scores whether the trader is supplying or taking liquidity during the settlement period, giving higher scores for clusters where they are aggressively trading and lower scores for when they are mostly being filled passively.
    • Higher scores are also given to a trader who has higher percentages of the total market volume during settlement.

Score interpretation

The score assigned to a cluster is based on a sliding scale between 0-100 using a weighted calculation. A score of 75 and above is a good indication that the suspect trading activity occurred.

Based on TT Trade Surveillance best practices, clusters that score over 75 are deemed to be “high risk” and should be the primary focus of users during their compliance reviews.

Scorecard metrics

The Marking the Close cluster scorecard includes metrics that help you determine if price manipulation may have occurred during the instrument’s settlement period.

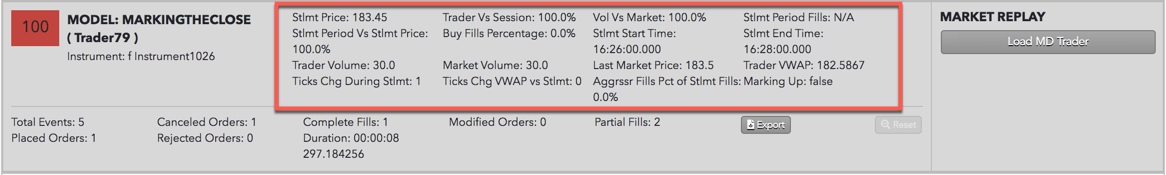
The following metrics are provided:

  • Stlmt Price — The daily settlement price reported by the exchange.
  • Trader Vs Session — This is the percent of the trader’s total activity for the day that occurred during the instrument’s settlement window. A high percentage of activity by the trader during the small settlement window may indicate a trader targeted the settlement window in an attempt to affect the settlement price.
  • Vol Vs Market — Shows the trader’s settlement volume as a percentage of the total settlement volume. A higher percentage of volume may indicate that the trader’s activity had a greater impact on the eventual settlement price.
  • Stlmt Period Buy/Sell Fills — Displays the VWAP of the fills on the suspect side of the market: buy fills for upward price movement over the settlement price, or sell fills for downward price movement below the settlement price.
  • Stlmt Period Vs Stlmt Price — Shows the last market price of the instrument prior to the settlement period compared to the settlement price. This gives you an approximation of how much the price moved up or down during the settlement period. Calculated as a ratio of settlement price before/during the settlement period.
  • Buy Fills Percentage — Displays the percent of fills that the trader had on the buy side of the market during settlement. Note that a “1” indicates that all of the trader’s fills were on the buy side, while a “0” indicates that the trader only had fills on the sell side.
  • Stlmt Start Time — The Settlement start time and end time set and published by the exchange. Fills that occurred during this time window are typically used to calculate the settlement price of an instrument or related product.
  • Stlmt End Time — The Settlement start time and end time set and published by the exchange. Fills that occurred during this time window are typically used to calculate the settlement price of an instrument or related product.
  • Trader Volume — Total trader volume during settlement. A high total volume may indicate that the trader’s activity had a greater impact on the eventual settlement price.
  • Market Volume — Total market volume during settlement.
  • Last Market Price — The last market price prior to the settlement period.
  • Trader VWAP — The trader settlement period VWAP.
  • Ticks Chg During Stlmnt — Number of ticks between the last market price and the settlement price.
  • Ticks Chg VWAP vs Stlmnt — The number of ticks difference in price movement between VWAP and settlement.
  • Aggrssr Fills Pct of Stlmnt Fills — The percentage of fills during settlement that are aggressing order fills.
  • Marking Up — Displays either “True” or “False”.

Identifying Marking the Close

In addition to the scorecard metrics, the Marking the Close chart and audit trail can also help identify Marking the Close trading activity. The following image shows results from inspecting a Marking the Close trading cluster.

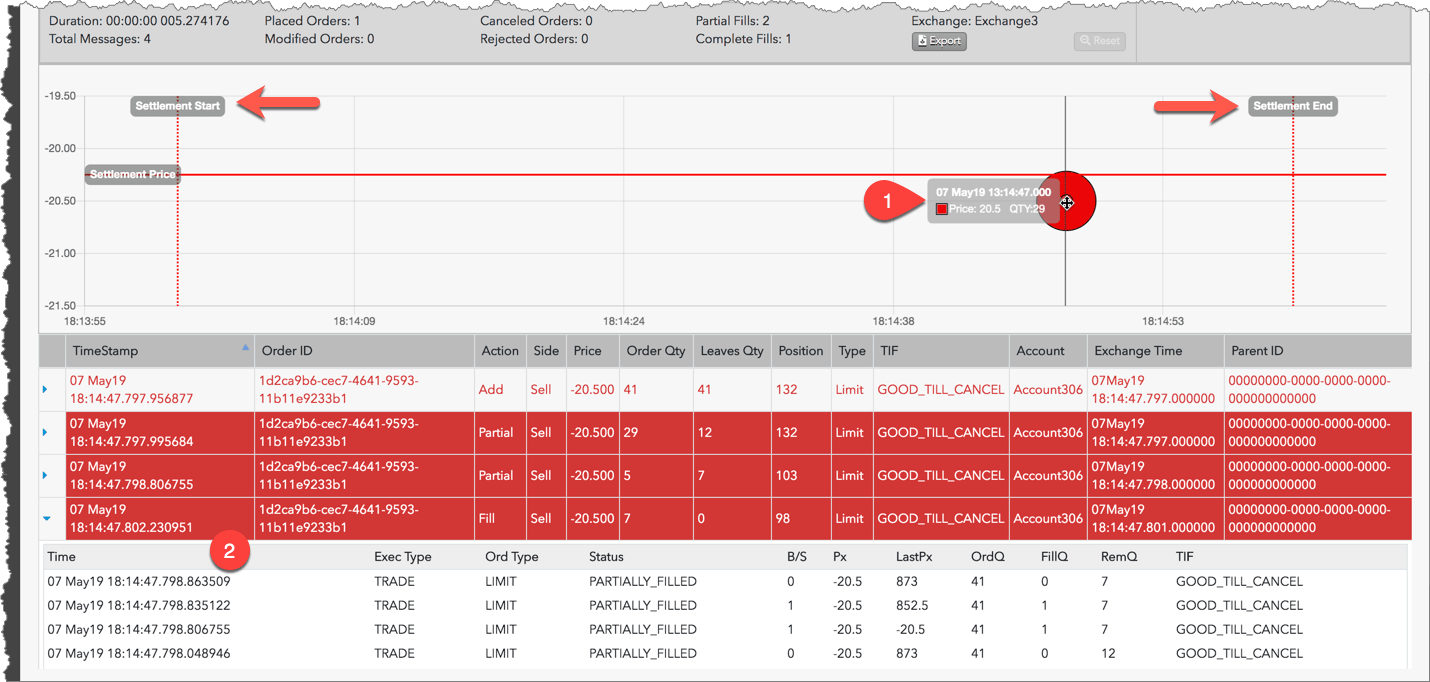
When investigating Marking the Close clusters in TT Trade Surveillance, check for the following indications of potential price manipulation:

  1. In the chart, look for a high percentage of buys above the settlement price or sells below the settlement price within the settlement period. You can move the cursor over suspect trading markers between the settlement period start and end times to view the price, quantity, and time of the trade.
  2. In the audit trail, check if the fills were for aggressive orders entered during the pre-close settlement period or passive orders resting in the market before or during the settlement period. Click a row in the audit trail to expand it and view additional order and fill details.