


The %R indicator was developed by Larry Williams and introduced in his 1979 book How I Made $1,000,000 Trading Commodities Last Year. Williams %R is similar to a stochastic oscillator, as it normalizes the price as a percentage between 0 and 100. It is basically an inverted version of the ‘Raw %K’ value of a Fast Stochastic.
Selecting the Williams %R indicator allows you to set the Period (as number of minutes) and the color of the result.
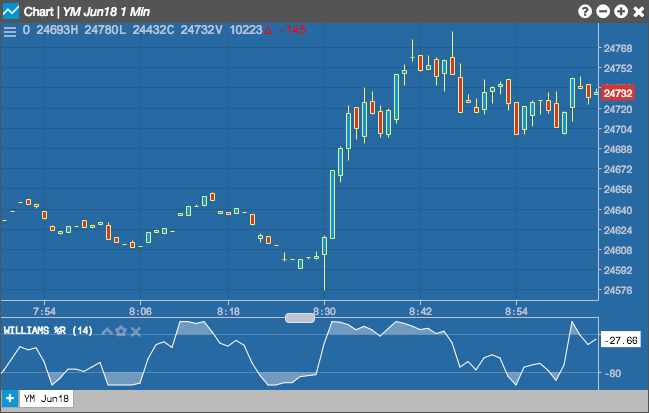
Configuration Options
- Period: Number of bars to use in the calculations.
- Color Selectors: Colors to use for graph elements.
- Over Zones Enabled: Whether to shade the area between the plot and the horizontal overbought and oversold levels.
- Over Bought: Overbought quantity
- Over Sold: Oversold quantity
- Display Axis Label: Whether to display the most recent value on the Y axis.
Formula
\[ \%R = -100 \times \left( \frac{(Highest\ High – Close)} {(Highest\ High – Lowest\ Low)} \right) \]
Where:
- Close = the current closing price
- Highest High = the highest high in the past n periods
- Lowest Low = the lowest low in the past n periods