


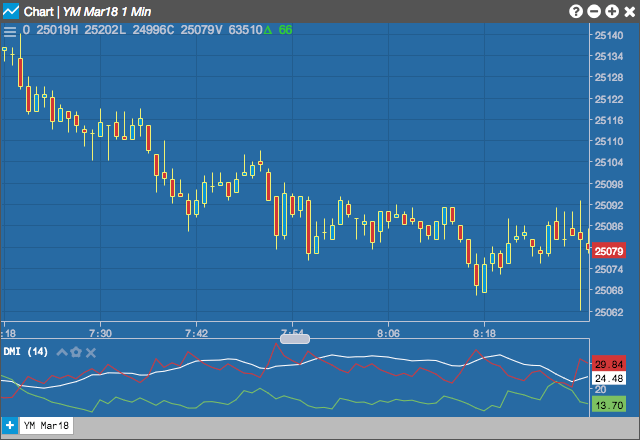
The Directional Movement Indicators (DMI) are components of the Directional Movement system published by J. Welles Wilder, and are computed with the Average Directional Movement Index (ADX). Two indicators are plotted, a Positive DI ( +DI ) and a Negative DI ( -DI ).
Configuration Options
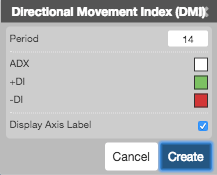
- Period: Number of bars to use in the calculations.
- Color Selectors: Colors to use for graph elements.
- Display Axis Label: Whether to display the most recent value on the Y axis.
Formula
Directional Movement (DM) is defined as the largest part of the current period’s price range that lies outside the previous period’s price range. For each period calculate:
The smaller of the two values is set to zero, i.e., if +DM > -DM, then -DM = 0. On an inside bar (a lower high and higher low), both +DM and -DM are negative values, so both get reset to zero as there was no directional movement for that period.
The True Range (TR) is calculated for each period, where:
Compute the positive/negative Directional Indexes, +DI and -DI, as a percentage of the True Range:
The next step is to calculate DX, where:
The DX is always a value between 0 and 100. The accumulated moving average technique is used to smooth the DX. The result is the ADX or average directional movement index.