Trade
Overview
TT Platform
Description
Task
Browser Access
Description
Task
Videos
TT Desktop
Description
Task
Videos
Reference
Workspace Windows
Description
Task
Videos
Widgets
Description
Task
Preferences
Description
Viewing Market Data
Time and Sales
Task
Reference
Description
Depth
Description
Task
Reference
Market Grid
Description
Task
Videos
Reference
Product Grid
Description
Task
Reference
Spread Matrix
Description
Task
Videos
Reference
Basic Order Entry
TT Order Types
Description
Task
Videos
Reference
Case Studies
TT Premium Order Types
Description
Task
Reference
Order Ticket
Description
Task
Use Cases
Reference
MD Trader®
Description
Task
Videos
Reference
Order Profiles
Description
Task
Reference
Routing Rules
Description
Task
Blocktrader
Description
Task
Videos
Reference
Trading Crypto on TT
Description
Task
Videos
Reference
Trading on B3
Order Management
Order Book
Description
Task
Reference
Floating Order Book
Description
Task
Reference
Fills
Description
Task
Reference
Positions
Description
Task
Reference
Orders and Fills
Description
Task
Reference
Audit Trail
Description
Task
Reference
Audit Query
Description
Task
Reference
Account List
Description
Task
Videos
Reference
Position Manager
Description
Task
Reference
Alert Manager and Alert Viewer
Description
Task
Videos
Reference
Account & User Restrictions
Description
Task
Reference
Balances
Description
Task
Reference
TT® OMS
Care Orders
Description
Task
Videos
Reference
Lock and Release
Description
Task
Bulking
Description
Task
Videos
Stitching and Splitting
Description
Task
Combining
Description
Task
Order Passing
Description
Task
Use Cases
Order Exceptions
Description
Task
Options
Options on TT
Description
Videos
Options Chain
Description
Task
Use Cases
Videos
Reference
Options Trade Monitor
Description
Task
Videos
Reference
Vol Curve Manager
Description
Task
Use Cases
Videos
Reference
Electronic Eye
Description
Task
Videos
Reference
RFQ Viewer
Description
Task
Videos
Reference
RFQ with Counterparties
Description
Task
Counterparty Manager
Description
Task
Strategy Creation
Description
Task
Use Cases
Reference
Options Risk
Description
Task
Videos
Reference
Options Risk Matrix
Description
Task
Videos
Reference
Watchlist
Description
Task
Videos
Reference
Expiration Manager
Description
Task
Volatility Calculator
Description
Task
TT Uncovered 2.0
Description
Task
TT Uncovered 3.0
Description
Task
QuikStrike
Description
Task
Spread Trading
Autospreader
Description
Task
Use Cases
Videos
Reference
Autospreader Rules
Description
Task
Videos
Reference
Hedge Manager
Description
Task
Videos
Reference
Trading in Yield
Description
Task
Use Cases
Reference
Aggregator
Description
Task
Videos
Reference
Algo Trading
Algo Dashboard
Description
Task
Videos
Reference
Template Manager
Description
Task
Order Management Algos (OMAs)
Autotrader
Description
Task
Reference
Videos
Excel integration with TT
Description
Task
Videos
Reference
Market-Making Algos
Analytics
Charts
Description
Technical Indicators
Task
Videos
Reference
Trader Analytics
Description
Task
Reference
ADL
ADL Overview
Introduction to ADL
Description
Task
Videos
Reference
ADL Basic Concepts
Description
Task
Reference
Building your first algo
Lessons
Advanced concepts
Description
Task
Case Studies
Jump blocks
Group blocks
Virtualized blocks
Library blocks
Trading Blocks
Discrete blocks
Arithmetic blocks
Basic blocks
Logic blocks
Miscellaneous blocks
Setup
Setup Overview
Getting Started
Description
Task
Videos
Reference
Supported Order Types and TIFs
Company Administration
Connections
Description
Task
Videos
Reference
Accounts
Description
Task
Videos
Use Cases
Reference
Users
Description
Task
Videos
Reference
Company
Description
Task
Reference
Order Tag Defaults
Description
Task
Account Administrators
Description
Task
TT Premium Services
Description
Task
TT Access
Description
Task
Advanced Features
Description
Risk Management
Risk Administration
Description
Task
Risk Limits
Description
Task
Videos
Reference
Pre-Trade Portfolio Risk
Description
Task
Reference
Order Cross Prevention
Description
Task
Videos
KRM Limits
Description
Task
TT® OMS
TT OMS Administration
Description
Task
Use Cases
Reference
Exchanges: Americas
B3
Description
Task
CBOE
Description
Task
Cboe FX
Description
Task
Reference
CFE
Description
Task
CME
Description
Task
Dealerweb
Description
Task
EBS Direct
Description
Task
EBS Market
Description
Task
Fenics
Description
Task
FMX
Description
Task
FMX_USTF
Description
Task
Goldman Sachs Commodity Blocks (GSCB)
Description
Task
Referece
ICE
Description
Task
MexDer
Description
Task
MIAX_FUT_CH
Description
Task
MIAX_FUT_NY
Description
Task
MX
Description
Task
Nodal
Description
Task
NFI
Task
Exchanges: EMEA
ATHEX
Description
Task
BIST
Description
Task
DGCX
Description
Task
EEX
Description
Task
EPEX SPOT
Description
Task
Reference
Eris
Description
Task
Eurex
Description
Task
Videos
Euronext
Description
Task
GFO-X
Description
Task
ICE_L
Description
Task
JSE
Description
Task
LME
Description
Task
LME NTP
Description
Task
LSE
Description
Task
MEFF
Description
Task
NDAQ_EU
Description
Task
NASDAQ_NED
Description
Task
Nord Pool
Description
Task
Reference
WSE
Description
Task
Exchanges: Asia/Pacific
ABX
Description
Task
ASX
Description
Task
FEX
Description
Task
HKEx
Description
Task
JPX
Description
Task
NSE
Description
Task
NZX
Description
Task
SGX
Description
Task
SGX GIFT
Description
Task
TAIFEX
Description
Task
TFEX
Description
Task
TFX
Description
Task
CoinFLEX
Task
Exchanges: Crypto
Coinbase
Description
Task
Kraken
Description
Task
FIX Support
FIX Ruleset
Description
Task
FIX Sessions
Description
Task
Secondary Accounts
Description
Task
Monitor
TT Mobile
TT Backtesting
APIs
TT REST API 2.0
Getting Started
API Reference
TT REST API 2.0 (UAT)
Getting Started
API Reference
TT .NET SDK
Getting started with TT .NET SDK
Creating the application framework
Working with instruments
Subscribing for market data
More about prices
An in-depth look at the Price class
Working with orders and fills
Handling trade subscriptions
Working with trade subscriptions
Working with Algos
Algo Server
TT Order Types
TT Premium Order Types
Advanced Concepts and Options
Appendix
TT CORE SDK
Getting Started with TT Core SDK
Creating Application Framework
Working With Instruments
Subscribing for Market Data
Working with Orders and Fills
Creating a TT Application Server
Appendix
TT Trade Surveillance
Overview
Using TT Trade Surveillance
Cluster View
Core Models
Market Abuse Models
Cross Product Models
Spoofing Models
Improperly Matched Trade Models
Market Rate Models
Trading Behaviors Models
Miscellaneous Models
Configurable Models
Reports
Wachlists
Reference
TT FIX Services
TT FIX General
Getting Started
FIX Message Structure
Session messages
TT FIX Order Routing
Overview
TT FIX message conversations
Supported application messages
TT FIX Market Data
Overview
TT FIX message conversations
Supported application messages
TT FIX Drop Copy Out
Overview
TT FIX Message Conversations
Supported application messages
Compliance Feed messages
TT FIX Drop Copy In
Overview
Supported application messages
TT FIX Gateway
Getting Started
FIX Message Structure
Components
Session messages
Price Gateway Messages
Order Gateway Messages
TT FIX Recovery
Overview
FIX Recovery Methods
Supported application messages
Compliance Feed Messages
MiFID II Support

Front Running

On this page

Front Running is an attempt to leverage insider knowledge of a future transaction to benefit from the impact to an instrument’s price. For example, a trader may submit their own trades before or after submitting a larger trade for one of their clients. The trader then benefits from the change in price due to the client’s trade.

The Front Running model detects an outlier point in time where significant changes in volume and price occur. From this point in time, the model can determine if a company’s trader(s) benefited from the outlier event earlier and/or later in the trading session.

Front Running scoring methodology

To detect potential Front Running, TT Trade Surveillance identifies minute bars where market volume exceeds a set percentile threshold (using all minute bars for that instrument in the clusters session) while the price of the instrument also moves significantly during the same minute. These outlier bars are indicated with a thin black outline of the green market volume bar in the chart. Minute candles are also displayed on the same chart and are lined up with the bar volumes of their respective minutes.

The Front Running model then determines if the company submitted a high portion of the volume during the outlier event, indicating that the company’s trading was a driver of the volume and price move outlier. Next, the model looks at different features of the company’s trading before, during and after the outlier, such as potential profit, aggressiveness and total price move to help inform the scoring.

The Front Running score is based on a sliding scale between 0-100. For example, a cluster score of “75” indicates that the company had trades that seemed to benefit from a larger outlier event.

Front Running scorecard metrics

The Scorecard Metrics section measures the following statistics related to Front Running:

  • acct_clust_sum_fillVol: The total buy and sell fill volume for the entire cluster, list by trading account.
  • comp_clust_count_traderAcct: The number of trader/account combinations that appear within the cluster.
  • comp_clust_pct_mktVol_on_aggr_side: The company’s percentage of the market (candle) volume on the “aggressive” side of the market (i.e., the side getting filled in with more liquidity-taking trades).
  • comp_clust_pct_vol_aggr_flagged: The company’s percentage of volume flagged as aggressive.
  • comp_clust_sum_mktVol: The company’s total sum of the market (candle) volume.
  • comp_outlierBar_pct_mktVol: The company’s percentage of market (candle) volume during the outlier event.
  • comp_sod_num_position: The company’s start-of-day position as calculated by TT Trade Surveillance.
  • mkt_outlierBar_delta_ticks: Outlier event’s price change, listed in ticks.
  • trader_clust_sum_fillVol: The total sum of filled buy and sell volume listed by trader.
  • trader_prepos_pct_mktVol: The trader’s percentage of market volume in the pre-positioning phase.
  • traderAcct_clust_sum_fillVol: The total sum of filled buy and sell volume listed by trader/account.

Identifying Front Running

The Front Running model displays all large volume events as green candles. The outlier event displays as a green candle surrounded by a thin black box. The model also displays the relevant trades as blue dots for buys and red dots for sells. The model connects the relevant trades to the outlier event using a light blue line to highlight the connection.

When investigating Front Running clusters with TT Trade Surveillance, consider the following:

  • The activity highlighted in the outlier event.
  • The aggressive score of trading activity before and after the outlier event.

Using the Cluster Scorecard, you can analyze the activity that triggered the high cluster score. The highlighted outlier event provides visual clues about the potential suspect trading pattern. The audit trail data on the scorecard can be used to verify order information and timing of the activity. The following example shows trading activity identified as potential Front Running.
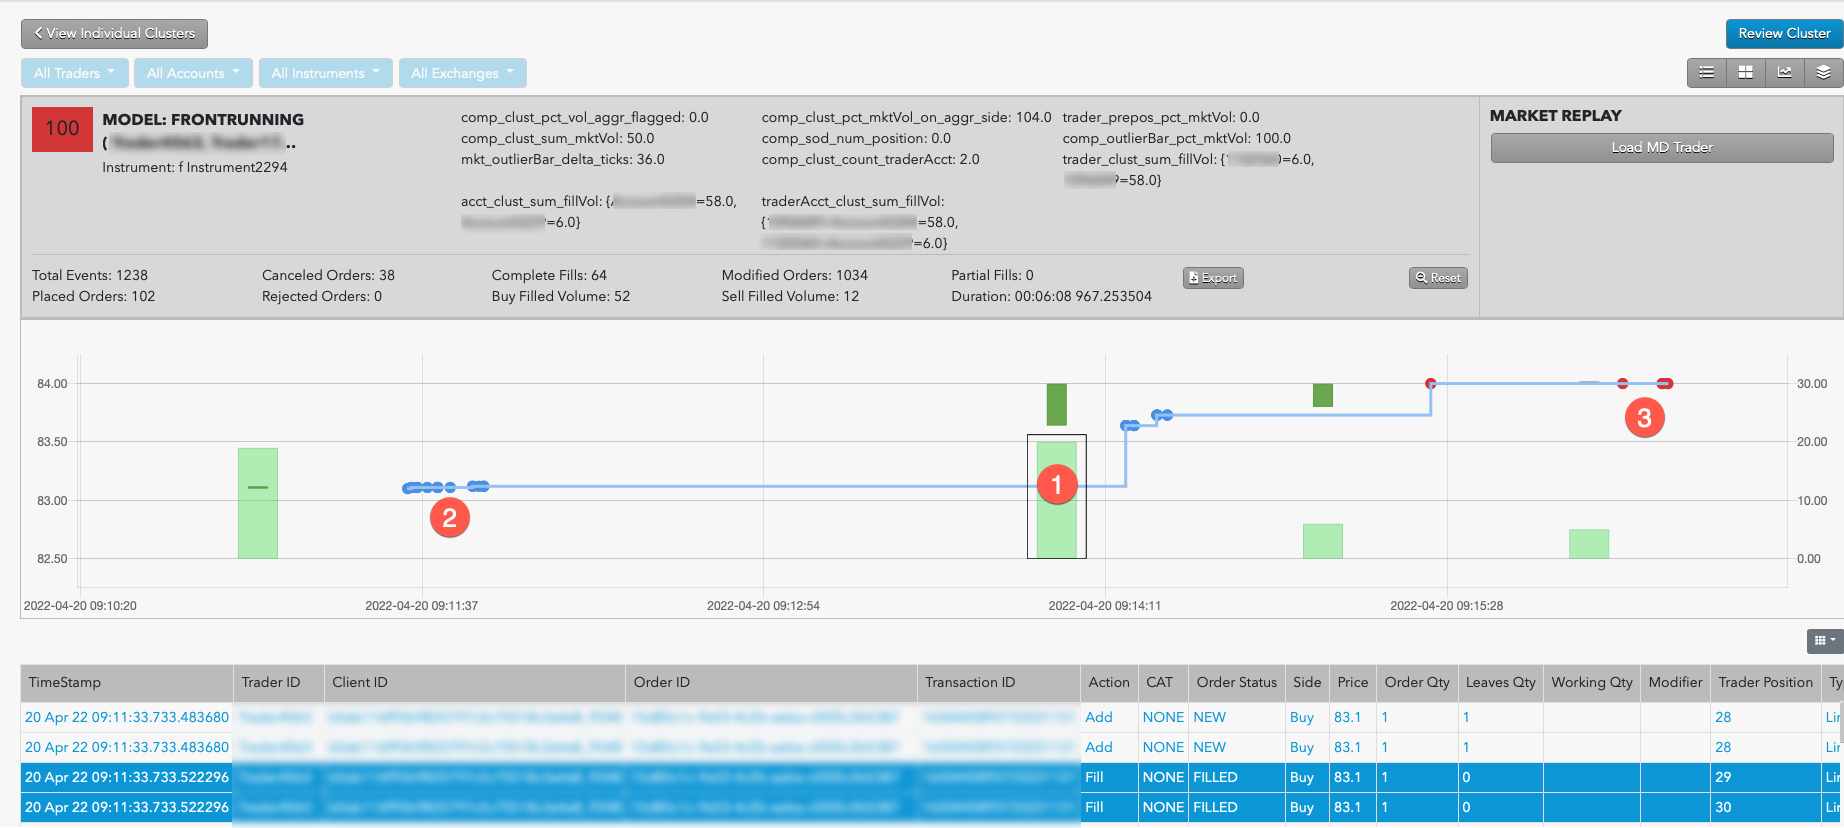
In this example:

  1. The outlier event shows a high volume of buy orders that causes an increase the instrument’s price.
  2. Prior to the outlier event, the trader filled a number of buy orders at a lower price.
  3. Following the outlier event, the trader filled a number of sell orders at the higher price.