Options Chain
Options Chain Reference
Context menu settings
The following setting options are available for the underlying futures contract and/or individual options contract:
- Open Vol Curve Manager — Opens the Vol Curve Manager widget seeded with the current expiry. This setting is available when you right-click the top panel of the Options Chain.
- Open — Allows you to open either MD Trader or an Order Ticket for an underlying futures contract or options contract. In addition, you can open the following widgets for an individual options contract:
- Strategy Creation
- Blocktrader
- Time and Sales
- Submit RFQ — Submits an RFQ for an underlying futures contract or individual options contract. Right-click the best Bid and Ask price for an underlying contract, or the data unique to a Call or Put options contract to select this setting.
- Send to Watchlist — Sends an underlying futures contract or individual options contract to the Watchlist widget. Right-click the best Bid or Ask price for an underlying contract, or the data unique to a Call or Put options contract to select this setting.
- Open Vol Calculator — Opens the Volatility Calculator for the selected options instrument.
- Transpose rows and columns — Switches the display of the rows and columns in the widget.
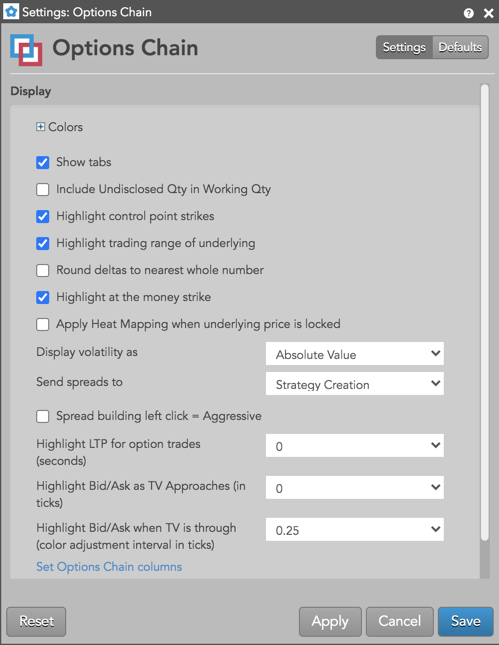
Available settings
These settings affect only the selected Options Chain widget. To update the default settings with these value for newly-opened Options Chain widgets, or to apply them to existing opened widgets, click Defaults.
-
Grid font size: Adjust the font size to suit your preferences and use bold text, if desired.
-
Colors: Allows you to customize or change the cell and column colors available in the widget.
-
Show tabs: Check to show tabs at the bottom of the widget. Uncheck to hide tabs.
- Include Undisclosed Qty in Working Qty — Displays the sum of working and undisclosed order quantities in the WrkBuys and WrkSells columns. Note: When this setting is enabled, undisclosed quantity values continue to be displayed in the UndBuys and UndSells columns.
-
Highlight control point strikes: Enable this setting to highlight the strike prices that reflect the control points on the volatility curve for the Options month.
-
Apply Heat Mapping when underlying is locked: Allows you to apply the heat mapping column shading to indicate implied prices and edge relative to the limit price and the theoretical underlying price when the underlying price is locked.
-
Highlight trading range of underlying: Check (enable) this setting to highlight the prices the comprise the midpoint of the underlying futures contract. When enabled, the prices are shaded and a green bar is displayed to show the best bid price, and a red bar is displayed to show the best ask for the underlying.
-
Round deltas to the nearest whole number: Set whether to round the call and put delta values.
-
Highlight at the money strike: Set whether to display a black line at the strike closest to the at-the-money price (underlying price).
-
Display volatility as: Select whether to display volatility as:
- Absolute Value: Show the absolute volatility.
- Diff From User Curve: Show volatility using the formula, X - User Curve, where X is the implied, fit, or settle value.
- Diff From Settle: Show volatility using the formula, X - Settlement, where X is the implied or fit value.
-
Send spreads to: Set whether to send spreads to the Strategy Creation, Strategy Creation (Linked), or Blocktrader widget. Linked Strategy Creation is available in Options Chain (new).
-
Highlight LTP for option trades (seconds): Set whether, and how long, to highlight the CLast or PLast price when a trade occurs.
-
Highlight Bid/Ask as TV Approaches (in ticks): Set whether to change the background color of the Bid/Ask price to white when the theoretical value approaches the market by the selected number of ticks (0, 0.125, 0.25, 0.5, 1, 2, 3, 4, 5). To turn highlighting off, set this value to zero.
-
Highlight Bid/Ask when TV is through (color adjustment interval in ticks): Set whether to shade Bid/Ask prices with yellow gradients based on how far the theortical value has gone through the market by the selected number of ticks (0, 0.125, 0.25, 0.5, 1, 2, 3, 4, 5). Darker shades indicate more edge. To turn highlighting off, set this value to zero.
-
Set Options Chain columns: Select the columns you want shown in the Options Chain.
-
Set Strategy buttons: Select which strategy templates you want to add as quick-access buttons.
Options Chain column descriptions
| Column | Description |
|---|---|
| Active | User volatility values that are used for calculating theoretical call and put values. These user-defined vols are entered using the Vol Curve Manager, which fits the curve to the control points on the volatility curve. The user volatility values are a result of the fitting process. |
| IV | Implied volatility value. Implied volatilities are calculated using the midpoint of bid and ask prices. |
| SV | Settlement volatility value, which indicates volatility calculated per strike using settlement prices. |
| Γ/Θ | Is a measure of how much money you will gain by owning the option due to movements in the underlying versus how much money you will lose in time decay (theta). Also known as epsilon. |
| Rho | Shows the change in options value per change in interest rate. |
| Vega | Shows the change in options value per change in volatility. |
| Theta | Shows the change in options value per change in time. Also known as time decay. |
| Gamma | Shows the change in delta per change in the underlying. |
| CΔ | Call delta calculated using "user volatility" if it is provided by the user, or "fit volatility" if it is not. |
| CBidQ | The total quantity working at the call option's bid price. |
| CBid | Best bid price for a call option at a given strike price. |
| CBidIV | Implied volatility of the Bid for Calls. |
| CTV | Call theoretical value, which is the theoretical price of a call option calculated using the Barone-Adesi and Whaley price model with volatility as an input. The volatility used is controlled by the user. The user vol curve is used if provided, or the fit vol curve is used if not. |
| CAsk | Best ask price for a call option at a given strike price. |
| CAskIV | Implied volatility of the Ask for Calls. |
| CAskQ | The total quantity working at the call option's ask price. |
| CVol | Total volume of calls traded at each strike price. |
| CStl | The call option's settlement price. |
| CLast | The call or put option's last traded price (LTP). |
| CPos | Net open position for a call. |
| Strike | Shows the underlying Futures contract price at which a holder can exercise their option to buy or sell the contract. The strike column reflects the range of the day by shading the strike. The high / low line indicators as seen on MD Trader® are displayed in the strike column relative to their position. |
| PVol | Total volume of puts traded at each strike price. |
| PStl | The put option's settlement price. |
| PLast | The put option's last traded price (LTP). |
| PPos | Net open position for a put. |
| PBidQ | The total quantity working at the put option's bid price. |
| PBid | Best bid price for a put option at a given strike price. |
| PBidIV | Implied volatility of the Bid for Puts. |
| PTV | Put theoretical value, which is the theoretical price of a put option calculated using the Barone-Adesi and Whaley price model with volatility as an input. The volatility used is controlled by the user. The user vol curve is used if provided, or the fit vol curve is used if not. |
| PAsk | Best ask price for a put option at a given strike price. |
| PAskIV | Implied volatility of the Ask for Puts. |
| PAskQ | The total quantity working at the put option's ask price. |
| PΔ | Put delta calculated using "user volatility" if it is provided by the user, or "fit volatility" if it is not. |
| WrkCBuys | The total quantity of working Call buy orders for an instrument. |
| WrkCSells | The total quantity of working Call sell orders for an instrument. |
| WrkPBuys | The total quantity of working Put buy orders for an instrument. |
| WrkPSells | The total quantity of working Put sell orders for an instrument. |
| PctGamma | Percent Gamma is the rate of change in Delta for a 1% move in the underlying instrument. |
| Δ Decay | Measures the rate of change of an option's Delta with respect to the passage of time. |
| Vanna | The rate at which the option's Delta will change in relation to changes in the volatility of its underlying market. |
| Vonna | Shows the rate of change to Vega as volatility changes. |
| Zomma | Shows the rate of change to Gamma as volatility changes. |
| OEV | Vega based option equivalence. Shows the equivalent number of ATM (at the money) options based on Vega. |
| Color | The rate of change in Gamma over a one day change in time (i.e., Gamma decay). |