Options Chain
Linking Charts to the Options Chain (new)
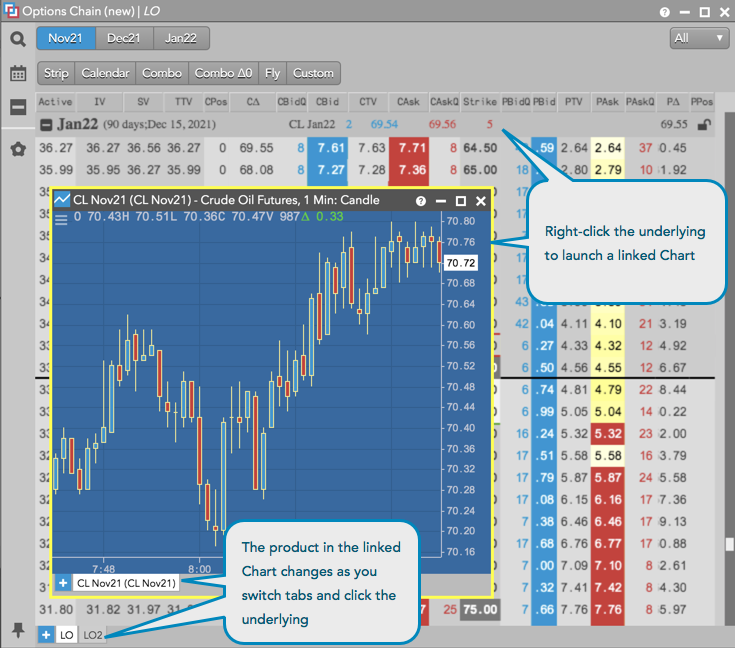
To display a Chart for the underlying instrument in the Options Chain, right-click on the best bid or offer for the underlying future and click Launch linked... | Chart from the context menu.
If the Options Chain contains more than one tab, the instrument displayed in the Chart will update when you switch tabs and click the underlying instrument in the term row. If another Options Chain widget is open in your workspace, switching focus to that widget will also update the instrument in the linked Chart when you click the underlying instrument.
