Options Chain
Options Chain (new) widget display
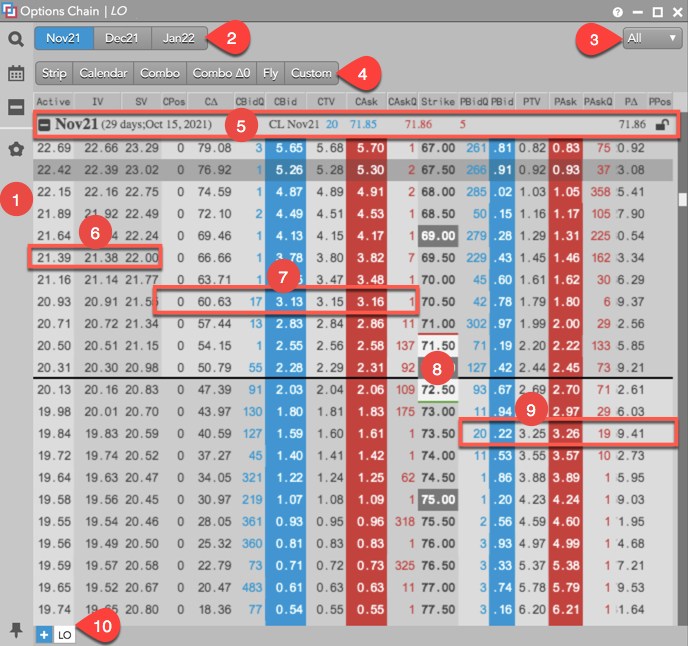
The Options Chain widget consists of the following elements as shown.
The widget includes:
- Side menu — Provides access to the functionality and settings in the Options Chain. The side menu includes:
 Market Explorer: Opens the Market Explorer to add a product to the Options Chain. Only one product can be
added per tab. When a product is selected, the number of expiries displayed in the widget is based on the "Number of Expiries exposed on Launch" setting in your workspace preferences.
Market Explorer: Opens the Market Explorer to add a product to the Options Chain. Only one product can be
added per tab. When a product is selected, the number of expiries displayed in the widget is based on the "Number of Expiries exposed on Launch" setting in your workspace preferences.
 Expiry Selector: A list of expiries for the underlying instrument. Multiple expiries can be selected. Market data for each expiry is displayed in the widget. As expiries are added, they are displayed at the top of the widget as actionable buttons.
 Expand/Collapse Button: Expands or collapses all columns for all expiries in the Options Chain.
 Settings: Opens the widget settings menu.
 Pin/Unpin: By default, the side menu is pinned and shown when the widget is opened.
- Expiry buttons and term panel — The expiries selected for the Option Chain. When an expiry is selected, it is shown as a button in the term panel. Click an expiry button to jump to the at-the-money strike of that expiry.
- Quick strike filter — Displays strike prices at a set number of levels above and below the current strike price for all expiries. Click the drop-down arrow to select one of the following price levels: 3, 7, 11, 99, All.
- Options spread building buttons — Allows you to select options contracts in the Options Chain to create synthetic options spreads as user-defined strategies in the Strategy Creation or block trades in the Blocketrader widget. Refer to Creating a strategy in the Options Chain.
- Term Row — Shows the product symbol and expiry selected for the Options Chain. Also shows the instrument name as well as the best Bid and Ask prices and quantities for the underlying futures contract. The "lock" icon
 indicates if the Options Chain is locked or unlocked at the underlying price in the lock field (e.g.,
  ). Click the expand/collapse button for a term row to show/hide all strikes for that expiry.
 - Volatility — Columns that display volatility values for each options contract.
- Call Market Data — Columns that display prices and quantities for Call options contracts.
- Strike — Shows prices for exercising the option to buy or sell the underlying.
- Put Market Data — Columns that display prices and quantities for Put options contracts.
- Tabs — Allow you to add different products to a single Options Chain widget. Each tab shows the product name selected. Tabs can be renamed.
Options Heat Mapping
Using the Colors in the Options Chain settings, you can highlight potential trading opportunities based on the relationship between your theoretical values and the market. In the Options Chain, Bid/Ask prices are highlighted when their theoretical values approach the market by a number of ticks. Prices are displayed in gradient yellow shades to indicate how far the theoretical values have crossed through the market.
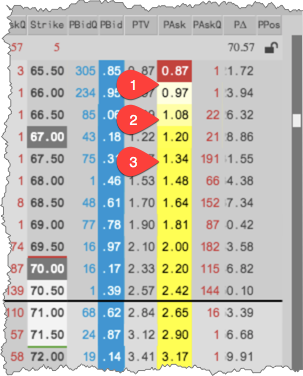
The above image shows:
- The theoretical value is highlighted white when it's approaching the market.
- The lighter shade of yellow indicates the theoretical price slightly crossed the market, which indicates a small edge at that price level.
- The darker shade of yellow indicates the theoretical price crossed the market by a greater amount, which indicates more edge at that price level.