Charts
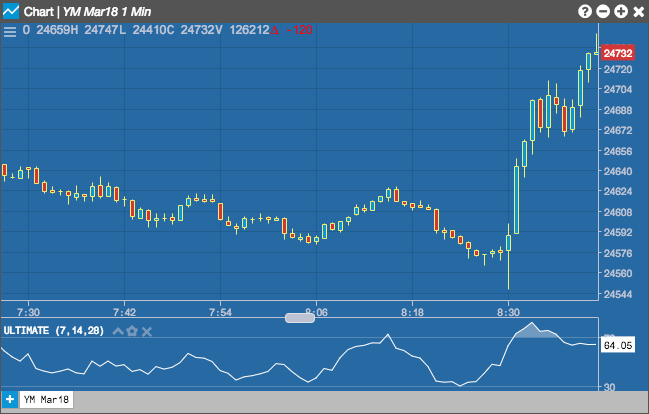
Ultimate Oscillator (ULTOSC)
The Ultimate Oscillator (ULTOSC) by Larry Williams is a momentum oscillator that incorporates three different time periods (i.e., Cycles) to improve the overbought and oversold signals.
When selecting the Ultimate Oscillator, you may configure the three different time periods by adding values in the Cycles settings.
Configuration Options
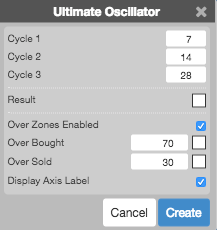
- Cycle 1: Number of periods to include in the first cycle.
- Cycle 2: Number of periods to include in the second cycle.
- Cycle 3: Number of periods to include in the third cycle.
- Color Selectors: Colors to use for graph elements.
- Over Zones Enabled: Whether to shade the area between the plot and the horizontal overbought and oversold levels.
- Over Bought: Overbought quantity
- Over Sold: Oversold quantity
- Display Axis Label: Whether to display the most recent value on the Y axis.
Formula
ULTOSC = 100 x [(4 x Average7)+(2 x Average14)+Average28]/(4+2+1)
\[ ULTOSC = 100 \times \frac{(4 * Average_\text{cycle1}) + (2 * Average_\text{cycle2}) + Average_\text{cycle3}}{(4 + 2 + 1)} \]
where:
\( Average_\text{cycle1} = \frac{\sum(\text {cycle1-period BP})}{\sum(\text {cycle1-period TP})} \)
\( Average_\text{cycle2} = \frac{\sum(\text {cycle2-period BP})}{\sum(\text {cycle2-period TP})} \)
\( Average_\text{cycle3} = \frac{\sum(\text {cycle3-period BP})}{\sum(\text {cycle3-period TP})} \)
\[ BP\; (\text{Buying Power}) = Close - Minimum(Low, PreviousClose) \]
\[ TR\; (\text{True Range}) = Maximum(High, PreviousClose) - Minimum(Low, PreviousClose) \]