Charts
Formatting charts
To format and configure your chart, you can:
- Change the chart type
- Change the time interval
- Display daily values
- Display historical data
- Move the price axis
- Group charts together
- Use LTP to build spread charts
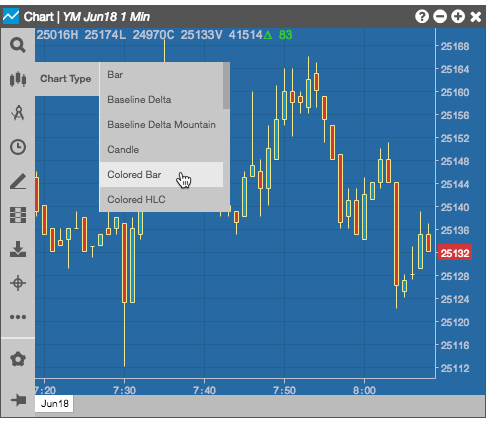
Changing the chart type
You can display intervals of historical data using different chart types or styles.
To change the chart type:
- Click
 (the chart menu icon) in the top left corner of the chart and click
  (the Chart Type icon) in the Chart menu.
 -
Select a chart type.
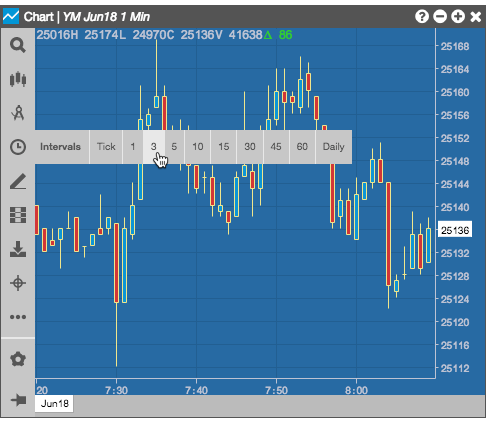
Changing the interval
The time interval settings determine how often the chart displays historical market data for the instrument. The default interval is one minute.
To change the time interval:
-
Click (the chart menu icon) in the top left corner of the chart and click
 (the Intervals icon) in the Chart menu.
-
Select an interval.
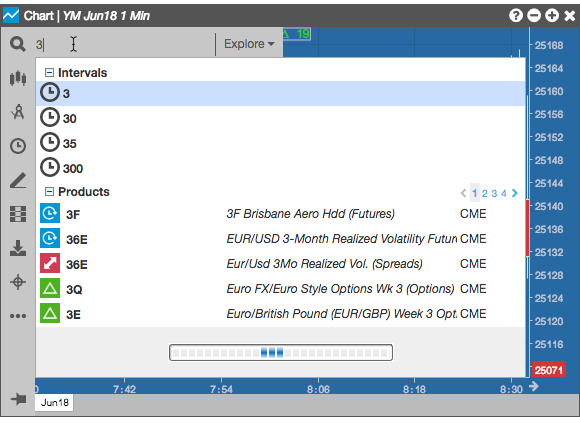
-
Optionally, you can click
 (the Search Instruments icon) and type a numeric value in the search field to display the matching intervals in the Search results.
Displaying daily values
By default, the Chart widget displays a daily value box in the top-left corner that includes the following information:
- O — Opening price for the current day
- H — Highest price for the current day
- L — Lowest price for the current day
- C — Closing price for the previous trading day
- Δ — Net change between the previous closing price and the current last price
- V — Total volume traded for the current day
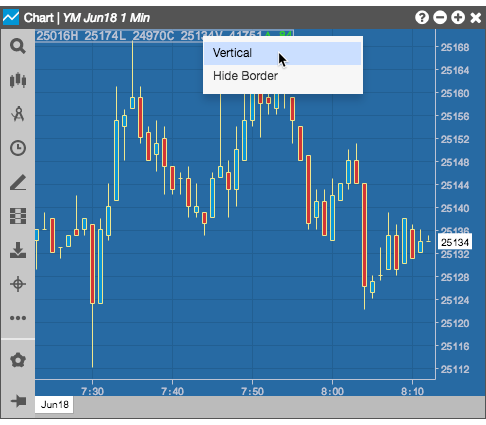
Right-click the daily value box to show/hide the border around the daily values. By default, the daily value box is displayed with the border hidden.
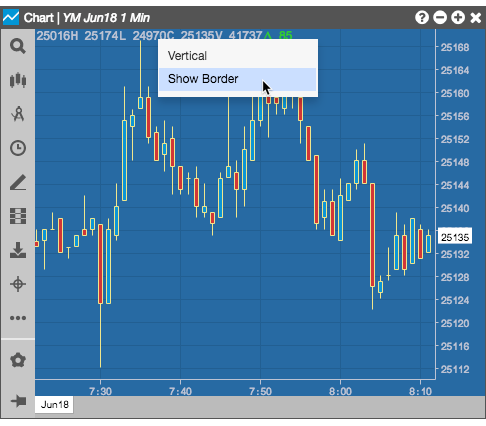
You can display the daily value box with a vertical or horizontal orientation by right-clicking on the box and selecting the alternate orientation.
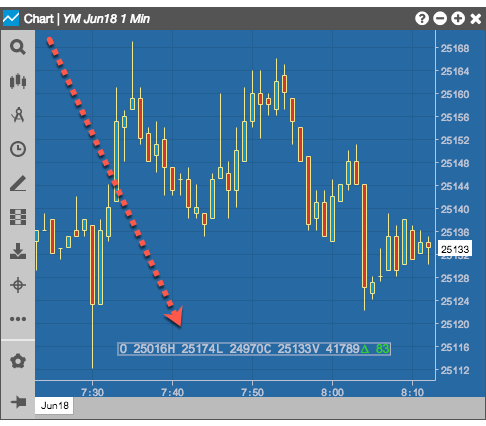
You can click-and-hold and drag-and-drop the daily value box to different locations on the chart.
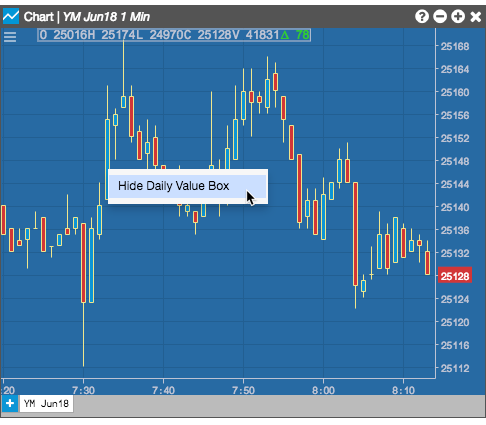
You can also hide (or show) the box by selecting the desired effect from the widget's right-click context menu.
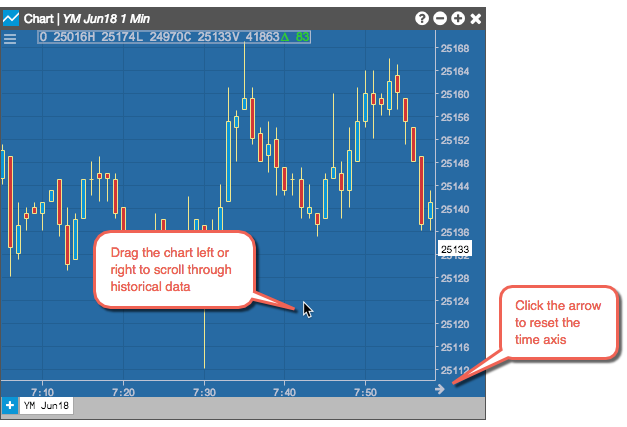
Displaying historical data
You can click-and-hold in the chart and drag the cursor to the right or left to change the range of time displayed in the chart.
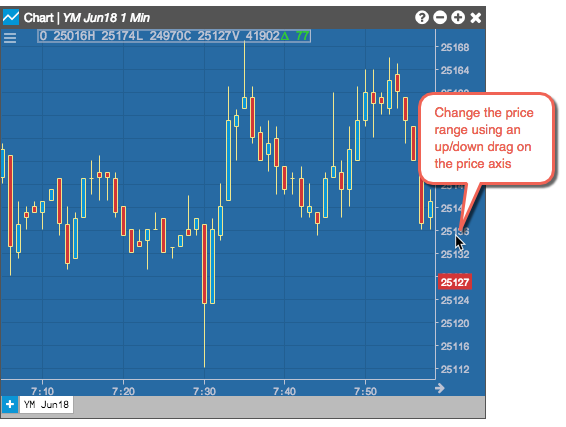
Moving the price axis
Click-and hold the price axis, then drag the mouse up or down to change the range of prices displayed in the chart.
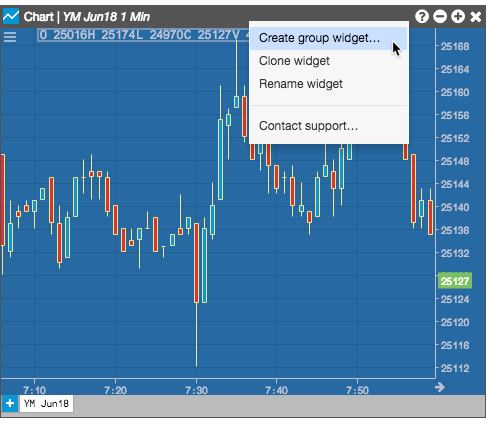
Grouping charts together
You can right-click in the title bar to create a widget group for your Charts.
Use LTP to build spread charts
By default, charts use the difference of Bid prices of spread legs when building a chart for Autospreader spreads. If desired, you can use the difference in LTP (last traded price) of the legs instead.
To use LTP, you can right-click on the price (Y) axis and select LTP for the Spread Formula in the context menu.
