Charts
Valuation Lines
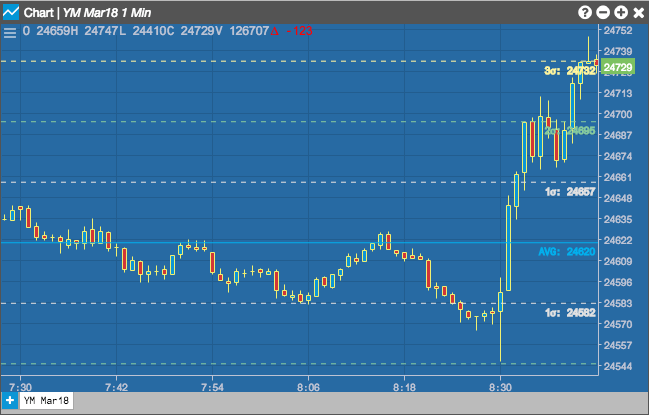
The Valuation Lines indicator displays a line representing the average of the visible prices in the chart. It also allows you to display lines for 1-3 standard deviations away from the average type.
Configuration Options
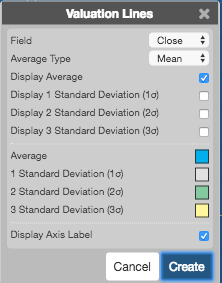
- Field: Price or combination of prices to use as the base for average calculations. Possible values include:
- Open
- High
- Low
- Close
- Adjusted Close
- HL/2 \( \left ( \frac{High + Low}{2} \right ) \)
- HLC/3 \( \left ( \frac{High + Low + Close}{3} \right ) \)
- HLCC/4 \( \left ( \frac{High + Low + Close + Close}{4} \right ) \)
- OHLC/4 \( \left ( \frac{Open + High + Low + Close}{4} \right ) \)
-
Average Type: Type of average calculation to use:
- Mean
- Median
- Harmonic
- Display Average: Whether to display the average line.
- Display 1 Standard Deviation (1o): Whether to display the first standard deviation line.
- Display 2 Standard Deviation (2o): Whether to display the second standard deviation line.
- Display 2 Standard Deviation (3o): Whether to display the third standard deviation line.
- Color Selectors: Colors to use for graph elements.
- Display Axis Label: Whether to display the most recent value on the Y axis.
Formula
VL = Average of Visbile Prices