Charts
Ulcer Index
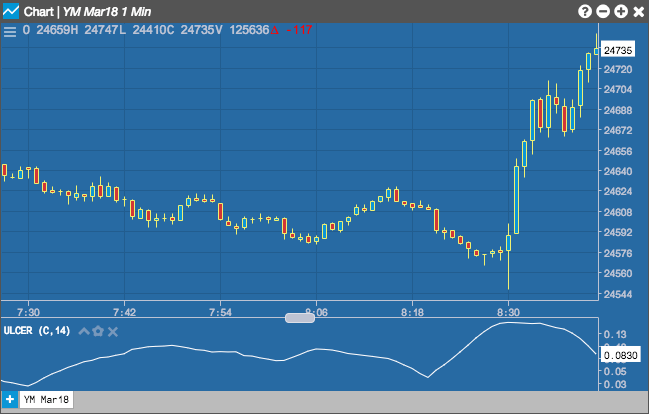
The Ulcer Index (UI) indicator can be used to determine downside risk by displaying the depth and duration of price declines from their earlier highs. A high UI value is generally an indication that the instrument's price has moved further away from its previous high and may take longer to return to this value.
Configuration Options
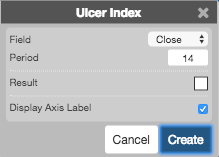
- Field: Price or combination of prices to use as the base for average calculations. Possible values include:
- Open
- High
- Low
- Close
- Adjusted Close
- HL/2 \( \left ( \frac{High + Low}{2} \right ) \)
- HLC/3 \( \left ( \frac{High + Low + Close}{3} \right ) \)
- HLCC/4 \( \left ( \frac{High + Low + Close + Close}{4} \right ) \)
- OHLC/4 \( \left ( \frac{Open + High + Low + Close}{4} \right ) \)
- Period: Number of bars to use in the calculations.
- Color Selectors: Colors to use for graph elements.
- Display Axis Label: Whether to display the most recent value on the Y axis.
Formula
The indicator is calculated in three steps:
\[ Percentage\; Drawdown = \frac{Close - (n\text{-}period\; High\; Close)}{n\text{-}period\; High\; Close} \times 100 \]
\[ Squared\;Average = \frac{\sum_{n=1}^{n\text{-}period} (Percentage\;Drawdown)^2}{n\text{-}period} \]
\[ Ulcer\;Index = \sqrt{Squared\;Average} \]