Charts
Keltner Channel (KC)
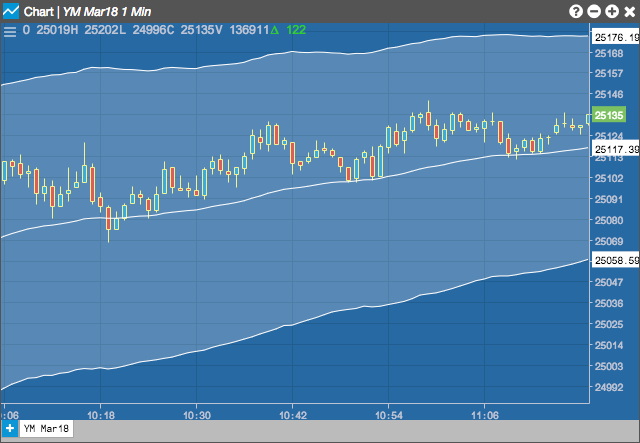
The Keltner Channel was introduced in 1960 by Chester W. Keltner in his book How To Make Money in Commodities, and is also explained by Perry Kaufman's book The New Commodity Trading Systems and Methods. Keltner Channels plots three lines, consisting of a simple moving average (typically of the average price) with upper and lower bands plotted above and below this moving average. The width of the bands is based on a user defined factor applied to the Average True Range, with this result added to and subtracted from the middle moving average line.
When prices cross the channel lines, it suggests some type of change is happening, based on the market directions:
- In a flat market, exceeding the bands can indicate overbought or oversold conditions.
- In a rising market, crossing the upper boundary can signal a potential breakout.
- In a falling market, crossing the lower channel boundary can signal some type of market weakness.
Configuration Options
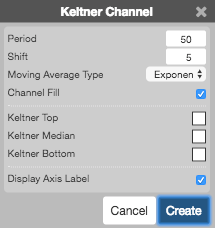
- Period: Number of bars to use in the calculations.
- Shift: Number of Average True Ranges (ATRs) above and below the moving average to draw the bands.
- Moving Average Type: Type of moving average to use in the calculations:
- Simple: Mean (average) of the data.
- Exponential: Newer data are weighted more heavily geometrically.
- Time Series: Calculates a linear regression trendline using the “least squares fit” method.
- Triangular: Weighted average where the middle data are given the most weight, decreasing linearly to the end points.
- Variable: An exponential moving average with a volatility index factored into the smoothing formula. The Variable Moving average uses the Chande Momentum Oscillator as the volatility index.
- VIDYA: An exponential moving average with a volatility index factored into the smoothing formula. The VIDYA moving average uses the Standard Deviation as the volatility index. (Volatility Index DYnamic Average).
- Weighted: Newer data are weighted more heavily arithmetically.
- Welles Winder:The standard exponential moving average formula converts the time period to a fraction using the formula EMA% = 2/(n + 1) where n is the number of days. For example, the EMA% for 14 days is 2/(14 days +1) = 13.3%. Wilder, however, uses an EMA% of 1/14 (1/n) which equals 7.1%. This equates to a 27-day exponential moving average using the standard formula.
- Hull: The Hull Moving Average makes a moving average more responsive while maintaining a curve smoothness. The formula for calculating this average is as follows: HMA[i] = MA( (2*MA(input, period/2) – MA(input, period)), SQRT(period)) where MA is a moving average and SQRT is square root.
- Double Exponential: The Double Exponential moving average attempts to remove the inherent lag associated to Moving Averages by placing more weight on recent values.
- Triple Exponential: TBD
- Simple
- Exponential
- Time Series
- Triangular
- Variable
- VIDYA
- Weighted
- Welles Winder
- Hull
- Double Exponential
- Triple Exponential
- Channel Fill: Whether to shade the area between the top and bottom bands.
- Color Selectors: Colors to use for graph elements.
- Display Axis Label: Whether to display the most recent value on the Y axis.
Formula
\[Middle Line = MA_{n}\;of \frac{(High + Low + Close)}{3}\]
\[Upper Band = Middle Line + ( y * ATR)\]
\[Lower Band = Middle Line - ( y * ATR)\]
where:
\[MA_{n} = User\;defined\;moving\;average\;of\;n-periods\] \[y = Shift = factor\;applied\;to\;the\;ATR\] \[ATR = Average\;True\;Range\;of\;n-period\]