Charts
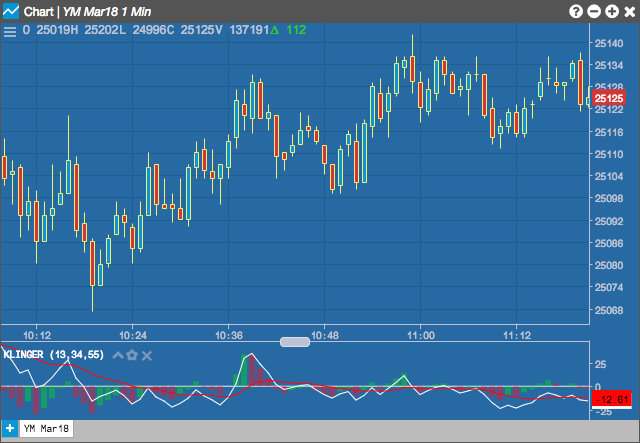
Klinger Volume Oscillator (KVO)
Klinger Volume Oscillator, developed by Stephen Klinger, uses the key price compared to the prior bar's key price to assign volume as positive or negative value.
Configuration Options
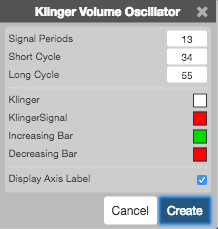
- Signal Periods: TBD
- Short Cycle: Number of periods to include in the short cyle.
- Long Cycle: Number of periods to include in the long cycle.
- Color Selectors: Colors to use for graph elements.
- Display Axis Label: Whether to display the most recent value on the Y axis.
Formula
\[Key\;Price_{t} = \frac{High_{t} + Low_{t} + Close_{t}}{3} \]
\[Key\;Price_{t-1} = \frac{High_{t-1} + Low_{t-1} + Close_{t-1}}{3} \]
\[ Trend = \begin{pmatrix} if\;Key\;Price_{t} > Key\;Price_{t-1}, & Volume \\ if\;Key\;Price_{t} < Key\;Price_{t-1}, & -Volume & \end{pmatrix} \]
\[KVO = EMA_{short-period}(Trend) - EMA_{long-period}(Trend) \]
\[KVO\;Signal = EMA_{signal}(KVO)\]
where
\[EMA = exponential\;moving\;average\;of\;user\;defined\;lengths\;of\;short-period,\;long-period,\;and\;signal.\]