Charts
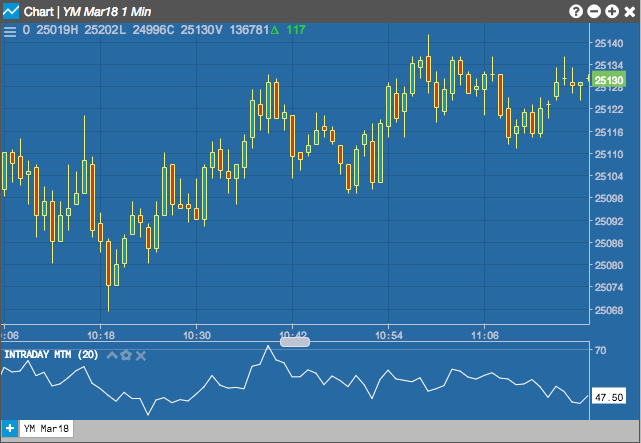
Intraday Momentum Index (IMI)
The Intraday Momentum Index (IMI) indicator is similar to the Relative Strength Index (RSI) indicator. It is used to measure underlying strength of a market move. IMI measures the change between the current bar's open and close prices, while RSI uses the prior bar's close to current bar's close change. The current price is normalized as a percentage between 0 and 100. /p>
Configuration Options
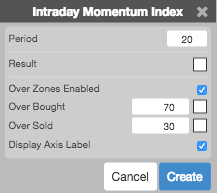
- Period: Number of bars to use in the calculations.
- Color Selectors: Colors to use for graph elements.
- Over Zones Enabled: Whether to shade the area between the plot and the horizontal overbought and oversold levels.
- Over Bought: Overbought quantity
- Over Sold: Oversold quantity
- Display Axis Label: Whether to display the most recent value on the Y axis.
Formula
For each period an upward and downward change is calculated as follows:
\[Upward = if\;Close_{t} - Open_{t} > 0\;then\;Close_{t} - Open_{t},\;else\;0 \]
\[Downward = if\;Close_{t} - Open_{t} < 0\;then\;Open_{t} - Close_{t},\;else\;0 \]
\[IMI = \frac{\sum_{i=1}^{n} Upward}{\left ( \sum_{i=1}^{n} Upward + \sum_{i=1}^{n} Downward \right )} \times 100\]