Charts
Ease of Movement (EOM)
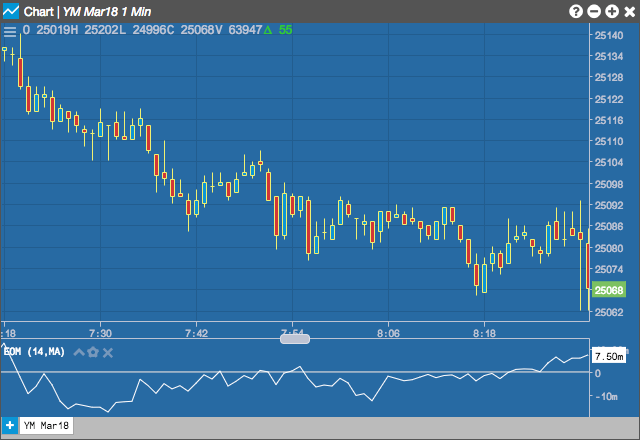
Ease of Movement, developed by Richard W. Arms, Jr., relates price change to volume and is particularly useful for assessing the strength of a trend. High positive values indicate the price is increasing on low volume and strong negative values indicate the price is dropping on low volume.
Configuration Options
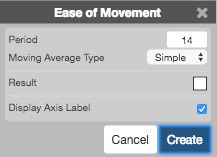
- Period: Number of bars to use in the calculations.
- Moving Average Type: Type of moving average to use in the calculations:
- Simple: Mean (average) of the data.
- Exponential: Newer data are weighted more heavily geometrically.
- Time Series: Calculates a linear regression trendline using the “least squares fit” method.
- Triangular: Weighted average where the middle data are given the most weight, decreasing linearly to the end points.
- Variable: An exponential moving average with a volatility index factored into the smoothing formula. The Variable Moving average uses the Chande Momentum Oscillator as the volatility index.
- VIDYA: An exponential moving average with a volatility index factored into the smoothing formula. The VIDYA moving average uses the Standard Deviation as the volatility index. (Volatility Index DYnamic Average).
- Weighted: Newer data are weighted more heavily arithmetically.
- Welles Winder:The standard exponential moving average formula converts the time period to a fraction using the formula EMA% = 2/(n + 1) where n is the number of days. For example, the EMA% for 14 days is 2/(14 days +1) = 13.3%. Wilder, however, uses an EMA% of 1/14 (1/n) which equals 7.1%. This equates to a 27-day exponential moving average using the standard formula.
- Hull: The Hull Moving Average makes a moving average more responsive while maintaining a curve smoothness. The formula for calculating this average is as follows: HMA[i] = MA( (2*MA(input, period/2) – MA(input, period)), SQRT(period)) where MA is a moving average and SQRT is square root.
- Double Exponential: The Double Exponential moving average attempts to remove the inherent lag associated to Moving Averages by placing more weight on recent values.
- Triple Exponential: TBD
- Simple
- Exponential
- Time Series
- Triangular
- Variable
- VIDYA
- Weighted
- Welles Winder
- Hull
- Double Exponential
- Triple Exponential
- Color Selectors: Colors to use for graph elements.
- Display Axis Label: Whether to display the most recent value on the Y axis.
Formula
The four calculation below are required for Ease of Movement indicator:
\[Distance\;Moved = DM = \left(\frac{High_{current} - Low_{current}}{2}\right) - \left(\frac{High_{previous} - Low_{previous}}{2}\right) \]
\[Box Ratio = BR = \left(\frac{\frac{Volume_{current}}{1,000,000,000}}{High_{current} - Low_{current}}\right) \]
Calculate a one period EOM:
\[EOM_{1} = \frac{DM}{BR}\]
Calculate the moving average where the user can pick from various moving average types:
\[EOM_{n-period MA} = MA(EOM_{1})\]