Charts
Ehler Fisher Transformation (EFT)
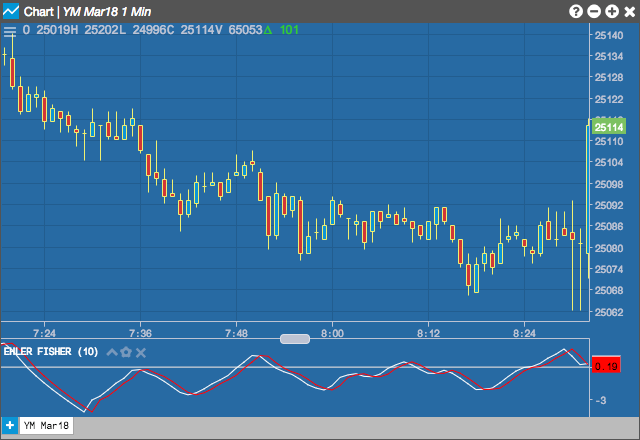
Ehler Fisher Transformation indicator tries to identify significant price reversals by normalizing prices over a user-specified number of periods. A reversal signal is suggested when the two lines cross.

Configuration Options

- Period: Number of bars to use in the calculations.
- Color Selectors: Colors to use for graph elements.
- Display Axis Label: Whether to display the most recent value on the Y axis.
Formula
\[MidPoint = MP = \frac{High - Low)}{2}\]
\[Intermediate = I = 2 \times \frac{MP - LowestLow_{n-periods}}{HighestHigh_{n-periods}-LowestLow_{n-periods}}\]
The intermediate term I is then smoothed by a 5-period exponential moving average (EMA) then transformed to a log form (fisher transform) before a final 3-period exponential moving average (EMA) smoothing:
\[I_{smoothed} = EMA_{5-period}\;of\;I\]
\[EFT = EMA_{3-period}\;of\;log \left ( \frac{1+I_{smoothed}}{1-I_{smoothed}} \right )\]