Charts
Donchian Width
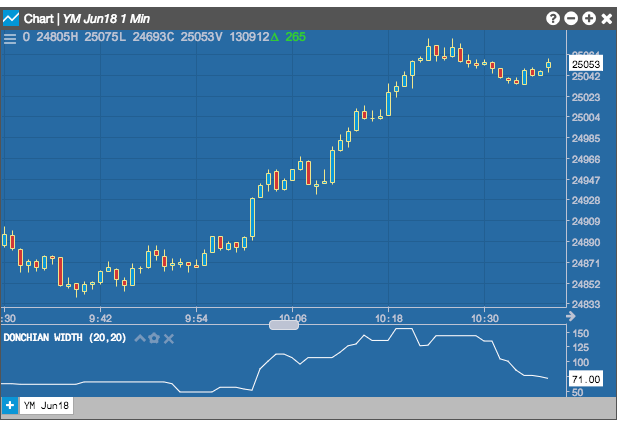
The Donchian Width (DW) indicator measures the difference between the high and low bands of the Donchian Channel indicator. The DW indicator rises when the width of the channel increases and descends when the width of the channel decreases, which indicates whether the volatility is increasing or descreasing.
Configuration Options
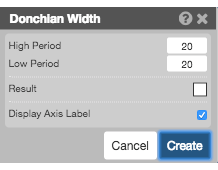
- High Period: Number of bars to use for the highest high price.
- Low Period: Number of bars to use for the lowest low price.
- Color Selectors: Colors to use for graph elements.
- Display Axis Label: Whether to display the most recent value on the Y axis.
Formula
\[ DW = DC_{upper} - DC_{lower} \]
where DC represents the bands of the Donchian Channel indicator.