Charts
Aroon (AR)
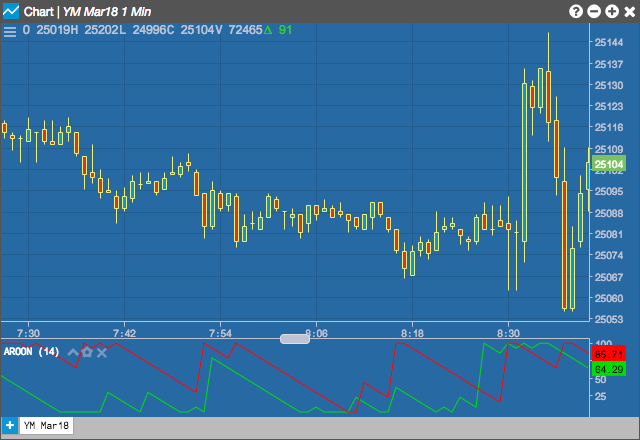
The Aroon (AR) indicator developed by Tushar Chande attempts to determine whether an instrument is trending and how strong is the trend. Aroon Up and Aroon Down lines make up the indicator with their formulas below. According to Chande, when the Aroon Up/Down values exceed 70, it indicates a strong upward or downward trend. Values below 50 indicate that the corresponding trends are weakening,
Configuration Options
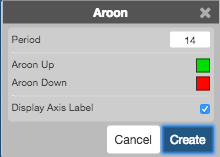
- Period: Number of bars to use in the calculations.
- Color Selectors: Colors to use for graph elements.
- Display Axis Label: Whether to display the most recent value on the Y axis.
Formula
\[Arron\;Up =\left ( \frac{Number\;of\;periods - Number\;of\;periods\;since\;highest\;high}{Number\;of\;periods} \right )\times 100\]
\[Arron\;Down =\left ( \frac{Number\;of\;periods - Number\;of\;periods\;since\;lowest\;low}{Number\;of\;periods} \right )\times 100\]