Charts
Alligator
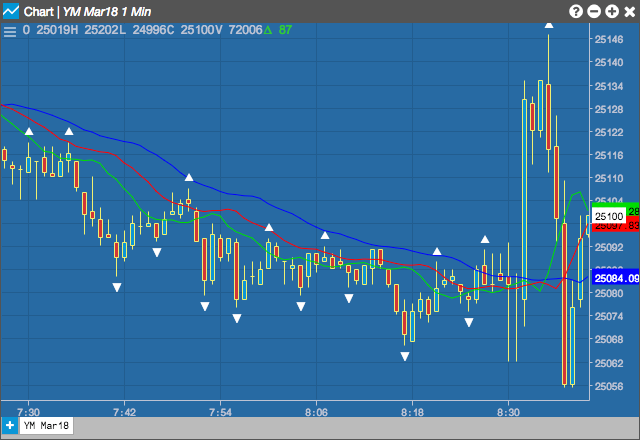
The Alligator indicator helps differentiate between trending and resting periods. The indicator consists of three lines, overlaid on a price chart, that represent the jaw, the teeth and the lips of the alligator. It indicates that a trend is in effect and in what direction the trend is moving.
The Alligator indicator uses three displaced moving averages to isolate market trends, consisting of the following defaults:
- The Jaw (blue line), which represents a 13-period moving average offset by 8 periods into the future.
- The Teeth (red line), which represents a 8-period moving average offset by 5 periods into the future.
- The Lips (green line), which represents a 5-period moving average offst by 3 periods into the future.

Configuration Options

- Jaw Period: Number of Smoothed Moving Average (SMMA) periods to use for the Jaw line.
- Jaw Offsett: Number of bars into the future to offset the Jaw line.
- Teeth Period: Number of Smoothed Moving Average (SMMA) periods to use for the Teeth line.
- Teeth Offset: Number of bars into the future to offset the Teeth line.
- Lips Period: Number of Smoothed Moving Average (SMMA) periods to use for the Lips line.
- Lips Offset: Number of bars into the future to offset the Lips line.
- Show Fractals:
- Color Selectors: Colors to use for graph elements.
- Display Axis Label: Whether to display the most recent value on the Y axis.
Formula
Smoothed Moving Average – Same calculation is an exponential moving average except the smoothing constant is different.
\[ SMA = \frac{P +wP_1 + w^2P_2 + ... + w^{n-1}P_{n-1}}{1 + w + w^2 + ... + w^{n-1}}\]
\[ Exponential\;smoothing\;constant = \frac{2}{(n+1)} \]
\[ Wilder\;smoothing\;constant = \frac{1}{n}\]