Charts
Aroon Oscillator (ARO)
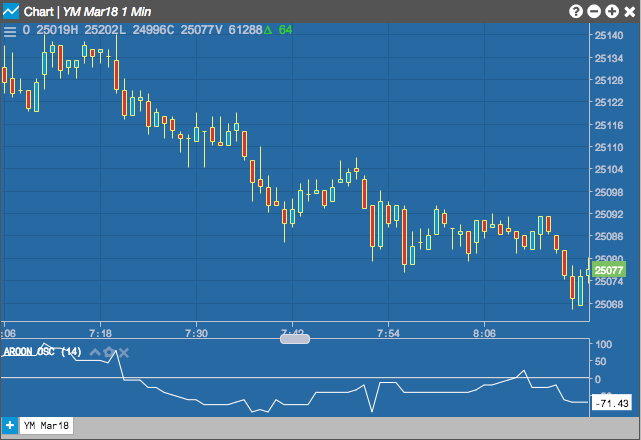
The Aroon Oscillator is a derivative of the Aroon indicator that provides a different way to view the results. It is constructed by subtracting Aroon Down from Aroon Up. The Aroon Oscillator oscillates between -100 and +100 with zero as the center line.
The Aroon Oscillator provides the following signals:
- Above zero signals an uptrend.
- Below zero indicates a downtrend.
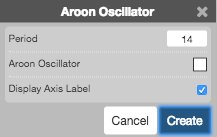
Configuration Options
- Field: Price or combination of prices to use as the base for average calculations. Possible values include:
- Open
- High
- Low
- Close
- Adjusted Close
- HL/2 \( \left ( \frac{High + Low}{2} \right ) \)
- HLC/3 \( \left ( \frac{High + Low + Close}{3} \right ) \)
- HLCC/4 \( \left ( \frac{High + Low + Close + Close}{4} \right ) \)
- OHLC/4 \( \left ( \frac{Open + High + Low + Close}{4} \right ) \)
- Color Selectors: Colors to use for graph elements.
- Display Axis Label: Whether to display the most recent value on the Y axis.
Formula
\[Aroon\;Osc = Aroon\;Up - Aroon\;Down\]
The formula uses the following equations, where n is the number of days:
\[ Aroon\;Up = \frac{100 * (n - (Days\;Since\;n-day\;High))}{n} \]
\[ Aroon\;Down = \frac{100 * (n - (Days\;Since\;n-day\;Low))}{n} \]
Aroon Down = 100 x (n – Days Since n-day Low)/n