


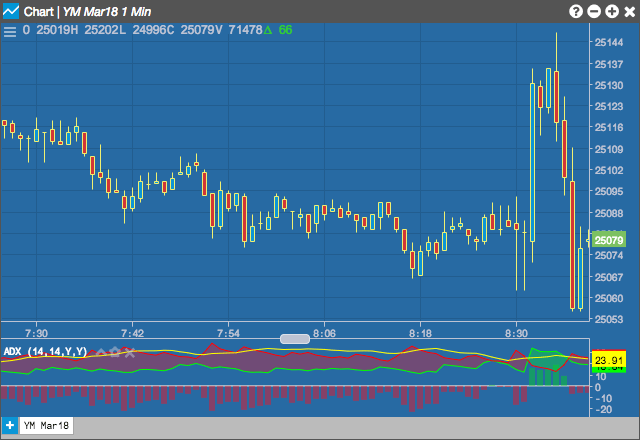
The Average Directional Movement Index (ADX) is designed to quantify trend strength by measuring the amount of price movement in a single direction. The ADX is part of the Directional Movement system published by J. Welles Wilder, and is the average resulting from the Directional Movement indicators.
Configuration Options
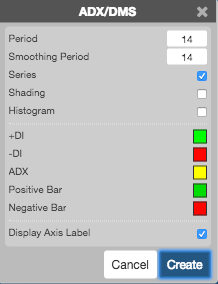
- Period: Number of bars to use in the calculations. The period value in the DM calculation corresponds to trader preference in RSI, Stochastics and other Welles Wilder studies. Daily charts use values of 9 to 14 with 10 being Wilder’s original.
- Smoothing Period: Number of bars to use when calculating the smoothed average.
- Series: Whether to display the curves.
- Shading: Whether to shade the areas between the DI curves when the +DI curve is greater than the -DI curve. Only valid when Series is enabled.
- Histogram: Whether to display the results as a histogram.
- Color Selectors: Colors to use for graph elements.
- Display Axis Label: Whether to display the most recent value on the Y axis.
Formula
-
Directional Movement (DM) is defined as the largest part of the current period’s price range that lies outside the previous period’s price range.
- PDM = current high minus the previous high (called plus DM)
- MDM = current low minus the previous low (called minus DM)
- If PDM > MDM then MDM is set to zero
- If MDM > PDM then PDM is set to zero
- If current range lies within or is equal to the previous range then set both PDM and MDM to zero
-
Calculate the value of the Plus and Minus Directional Indicators:
\[ PDI(n) = \frac{PDM(n) * 100}{ATR(n)}\]\[ MDI(n) = \frac{MDM(n) * 100}{ATR(n)}\]Where:
- \( n \) = Number of periods
- \( ATR \) = Average True Range
-
Calculate the absolute value of the Directional Movement Index (DMI):
\[ DMI = \left | \frac{(PDI – MDI)}{(PDI + MDI)} \right | \] -
Calculate the Average Directional Movement (DMIA a.k.a. ADX):
\[ DMIA(n) = Simple\;Moving\;Average\;of\;DMI \]
\[ \]