Charts
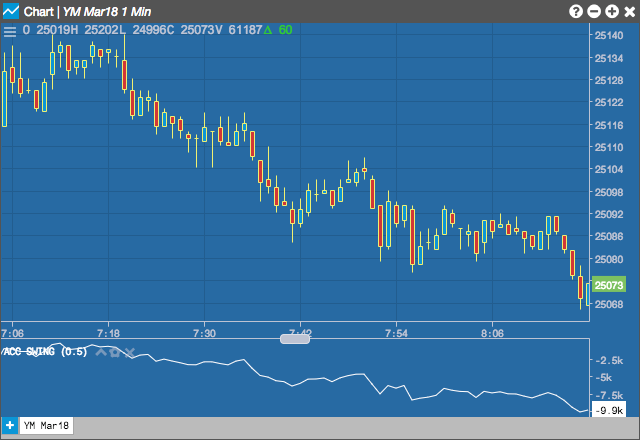
Accumulative Swing Index (ASI)
The Accumulative Swing Index created by Welles Wilder attempts to find the swing line within the bar. Originally created to apply to daily bars, as there is a market or user defined value of the maximum price change that can occur during the trading session. Using the study on intra-day bar data will require the user to specify a limit value for the given bar interval.
Welles Wilder created this indicator based on the below important reference points:
- Today's close is higher (lower) than the prior close
- Today's close is higher (lower) than today's open
- Today's high (low) is greater (less) than the prior close
- Today's low (high) is greater (less) than the prior close
- The prior close was above (below) the prior open.
Configuration Options
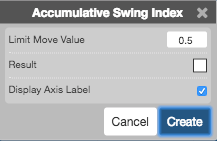
- Limit Move Value: Maximum price change during a trading session
- Result: Color of the technical indicator
- Display Axis Label: Check to show the axis label
Formula
\[ASI_{t} = ASI_{t-1} + SI_{t}\]
where\(SI_{t}\) is the current bar's swing index calculated by the formula:
\[SI_{t} = 50 \times \left ( \frac{Close_{t} - Close_{t-1}+0.5\times(Close_{t}-Open_{t})+0.25 \times (Close_{t-1}-Open_{t-1})}{R} \right ) \times \frac{K}{T}\]
where
\[K = max\left ( High_{t} - Close_{t-1}\;,\;Close_{t-1} - Low_{t} \right )\]
\(T\) is a user defined value which means the maximum price change during a trading session.
\(R\) is a value calculated on the base of the relationship between current close price and previous high and low prices. The formula is:
\[R = TR - 0.5 \times ER + 0.25 \times SH\]
where
\[TR = max(High_{t} - Close_{t-1} , Close_{t-1} - Low_{t} , High_{t} - Low_{t})\]
\[ER = \left\{\begin{matrix} High_{t} - Close_{t-1} & if Close_{t-1} > High_{t} \\ 0 & if Low_{t} \leq Close_{t-1} \leq High_{t} \\ Close_{t-1} - Low_{t} & if Close_{t-1} < Low_{t} \end{matrix}\right.\]
\[SH = Close_{t-1} - Open_{t-1}\]