Charts
Volume Underlay
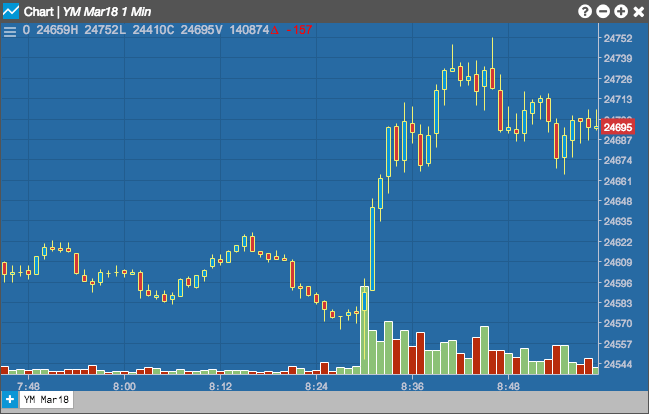
The Volume Underlay indicator simply displays the total volume as a bar chart beneath each of the chart's periods. Unlike other indicators that display in a sub-window, the Volume Underlay indicator displays within the actual chart.
Configuration Options
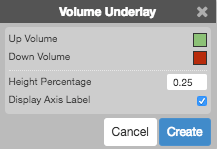
- Color Selectors: Colors to use for graph elements.
- Display Axis Label: Whether to display the most recent value on the Y axis.
Formula
The Volume Underlay equals the total volume.