Charts
Volume Rate of Change
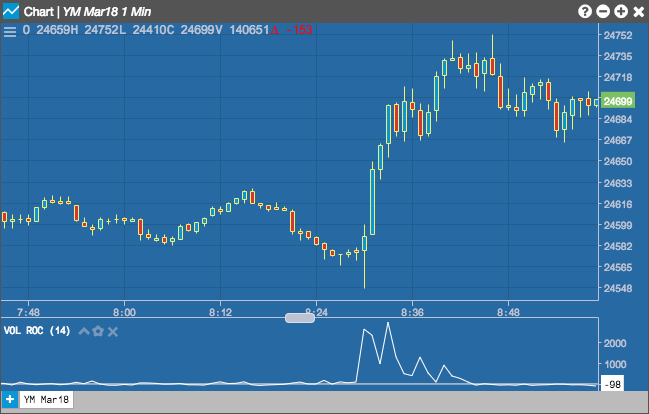
The Volume Rate of Change indicator measures the rate of change in the volume over a period of time.
Configuration Options
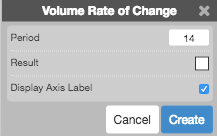
- Period: Number of bars to use in the calculations.
- Color Selectors: Colors to use for graph elements.
- Display Axis Label: Whether to display the most recent value on the Y axis.
Formula
\[ VROC = \frac{Volume - Volume_\text{previous-period}}{Volume_\text{previous-period}} \times 100 \]