Charts
Volume Oscillator
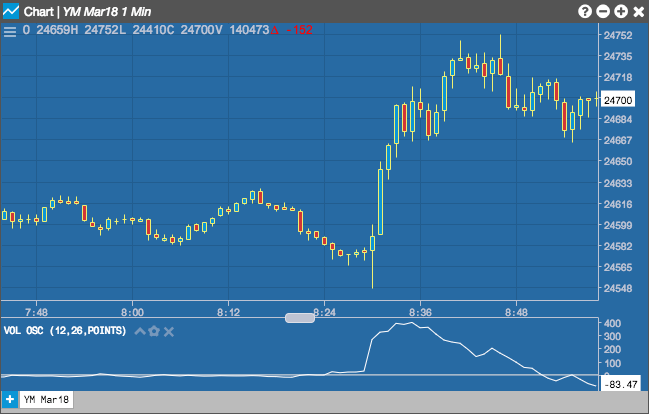
The Volume Oscillator displays the difference between two moving averages of a security's volume.
Configuration Options
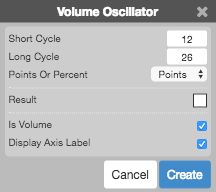
- Short Cycle: Number of periods in the fast volume moving average.
- Long Cycle: Number of periods in the slow volume moving average.
- Points or Percent: Whether to display the curve as the actual difference or as a percentage of the fast volume moving average.
- Color Selectors: Colors to use for graph elements.
- Is Volume: TBD
- Display Axis Label: Whether to display the most recent value on the Y axis.
Formula
\[ VO = \frac{Shorter Moving Average - Longer Moving Average}{Shorter Moving Average} \times 100\]