Charts
Time Series Forecast (TSF)
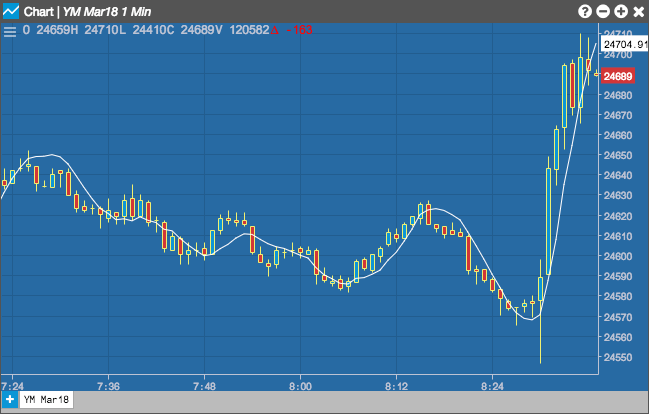
The Time Series Forecast (TSF) is a linear regression calculation that plots each bar's current regression value using the least square fit method. This indicator is sometimes referred to as a moving linear regression similar to a moving average. For example, the TSF value that covers 10 days will have the same value as a 10-day Time Series Forecast. This differs slightly from the Linear Regression indicator in that the Linear Regression indicator does not add the slope to the ending value of the regression line.
Configuration Options
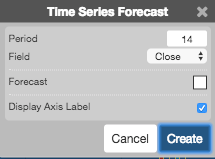
- Period: Number of bars to use in the calculations.
- Field: Price or combination of prices to use as the base for average calculations. Possible values include:
- Open
- High
- Low
- Close
- Adjusted Close
- HL/2 \( \left ( \frac{High + Low}{2} \right ) \)
- HLC/3 \( \left ( \frac{High + Low + Close}{3} \right ) \)
- HLCC/4 \( \left ( \frac{High + Low + Close + Close}{4} \right ) \)
- OHLC/4 \( \left ( \frac{Open + High + Low + Close}{4} \right ) \)
- Color Selectors: Colors to use for graph elements.
- Display Axis Label: Whether to display the most recent value on the Y axis.
Formula
The best fit line associated with the n points (x1, y1), (x2, y2), . . . , (xn, yn) has the form
y = mx + b