Charts
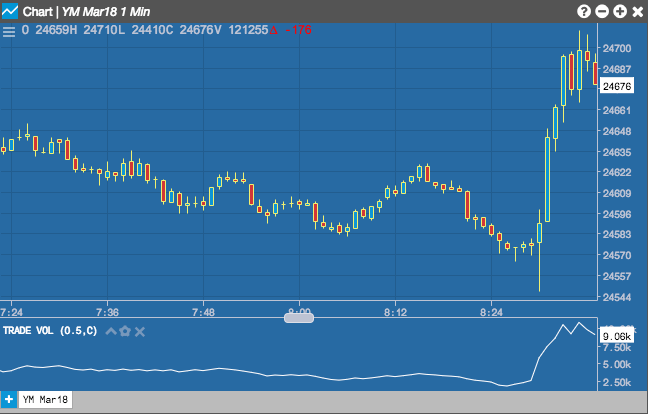
Trade Volume Index (TVI)
The Trade Volume Index (TVI) leverages intraday market data to show whether a security is being accumulated (purchased) or distributed (sold). The Trade Volume Index assumes that higher prices represent buy orders while lower prices are sell orders.
Configuration Options
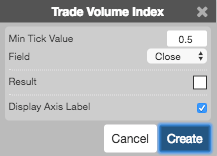
- Min Tick Value: Minimum price movement required to include in the calculation.
- Field: Price or combination of prices to use as the base for average calculations. Possible values include:
- Open
- High
- Low
- Close
- Adjusted Close
- HL/2 \( \left ( \frac{High + Low}{2} \right ) \)
- HLC/3 \( \left ( \frac{High + Low + Close}{3} \right ) \)
- HLCC/4 \( \left ( \frac{High + Low + Close + Close}{4} \right ) \)
- OHLC/4 \( \left ( \frac{Open + High + Low + Close}{4} \right ) \)
- Color Selectors: Colors to use for graph elements.
- Display Axis Label: Whether to display the most recent value on the Y axis.
Formula
\[EMA1 = EMA1_\text{n-1} + \left ((\frac{2}{(n + 1)}) * (P_n - EMA1_\text{n-1}) \right)\]
\(EMA2 = EMA2n-1 + ((2 / (n + 1)) * (EMA1n - EMA2n-1)))\
\[EMA2 = EMA2_\text{n-1} + \left ((\frac{2}{(n + 1)}) * (EMA1_n - EMA2_\text{n-1}) \right)\]
\(EMA3 = EMA3n-1 + ((2 / (n + 1)) * (EMA2n - EMA3n-1)))\
\[EMA3 = EMA3_\text{n-1} + \left ((\frac{2}{(n + 1)}) * (EMA2_n - EMA3_\text{n-1}) \right)\]
TRIX = (EMA3n - EMA3n-1 ) / EMA3n-1)\
\[ TRIX = \frac{(EMA3_n - EMA3_\text{n-1})}{EMA3_\text{n-1}} \]
where:
- Pn =the current price.
- EMA1n-1 = the exponential moving average value of n periods back
- EMA2n-1 = the exponential moving average value of n periods back
- EMA3n-1 = the exponential moving average value of n periods back