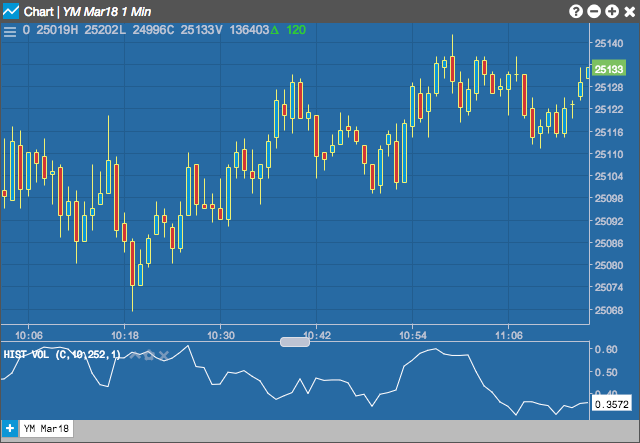
Charts
Historical Volatility (HV)
Historical Volatility is just a standard deviation of the underlying percent return over n-periods.
Configuration Options
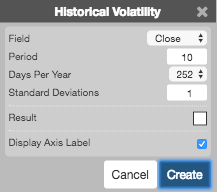
- Field: Price or combination of prices to use as the base for average calculations. Possible values include:
- Open
- High
- Low
- Close
- Adjusted Close
- HL/2 \( \left ( \frac{High + Low}{2} \right ) \)
- HLC/3 \( \left ( \frac{High + Low + Close}{3} \right ) \)
- HLCC/4 \( \left ( \frac{High + Low + Close + Close}{4} \right ) \)
- OHLC/4 \( \left ( \frac{Open + High + Low + Close}{4} \right ) \)
- Period: Number of bars to use in the calculations.
- Days Per Year: Whether to base the calculations on the numberr of calendar days or trading days in the year.
- Standard Deviations: Number of standard deviations to deviate from the average.
- Color Selectors: Colors to use for graph elements.
- Display Axis Label: Whether to display the most recent value on the Y axis.
Formula
\[HV = \sigma = \sqrt{\frac{\sum_{i=1}^{n}(r_{i}-m)^{2}}{(n-1)}}\]
where
\[\sigma = Standard\;deviation\]
\[r_{i} = \frac{P_{t}-P_{t-1}}{P_{t}}\]
\[m = MA\;or\;average\;of\;all\;data\;points\]
\[n = Number\;of\;data\;points\]