Charts
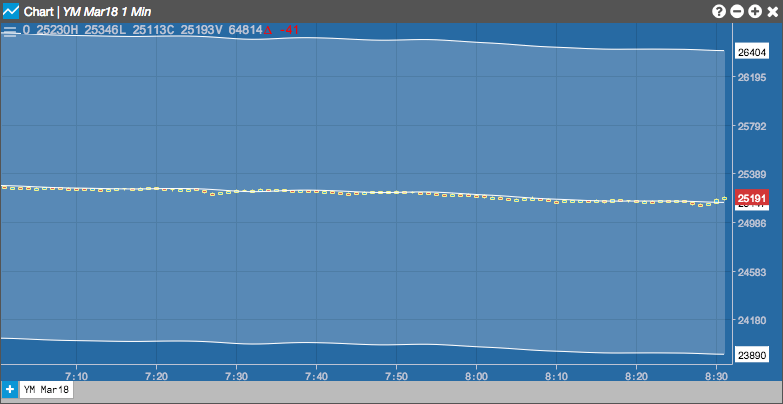
High Low Bands (HLB)
The High Low Bands indicator consist of moving averages calculated from the underling price, shifted up and down by a fixed percentage of the median price.
Configuration Options
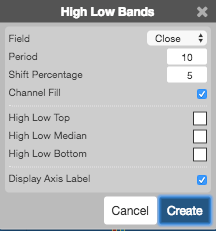
- Field: Price or combination of prices to use as the base for average calculations. Possible values include:
- Open
- High
- Low
- Close
- Adjusted Close
- HL/2 \( \left ( \frac{High + Low}{2} \right ) \)
- HLC/3 \( \left ( \frac{High + Low + Close}{3} \right ) \)
- HLCC/4 \( \left ( \frac{High + Low + Close + Close}{4} \right ) \)
- OHLC/4 \( \left ( \frac{Open + High + Low + Close}{4} \right ) \)
- Period: Number of bars to use in the calculations.
- Shift Percentage:
- Channel Fill: Whether to shade the region between the bands.
- Color Selectors: Colors to use for graph elements.
- Display Axis Label: Whether to display the most recent value on the Y axis.