Charts
High Minus Low (H-L)
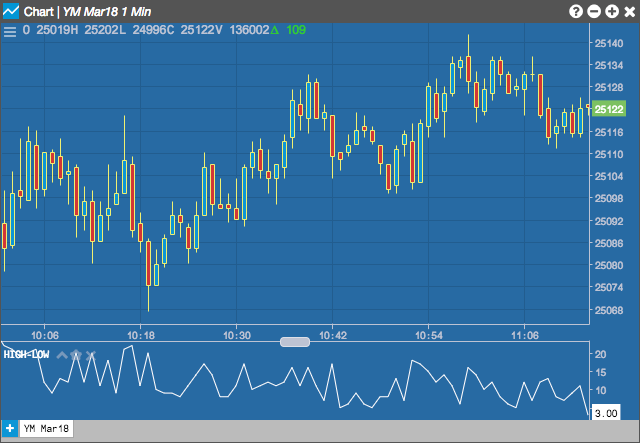
The High Minus Low indicator simply calculates the range of the bar, or High - Low value.
Configuration Options
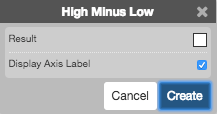
- Color Selectors: Colors to use for graph elements.
- Display Axis Label: Whether to display the most recent value on the Y axis.
Formula
\[Range = High - Low\]