Charts
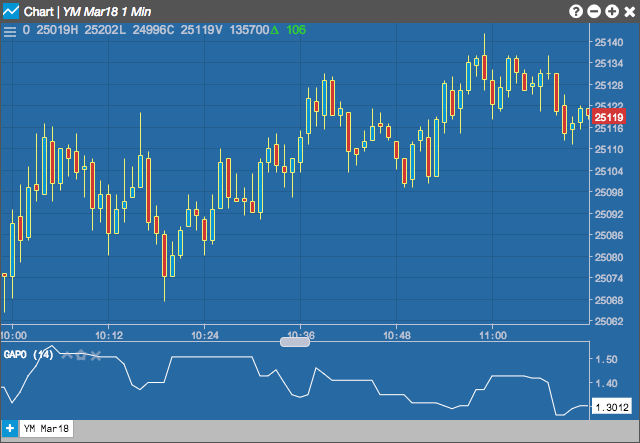
Gopalakrishnan Range Index (GAPO)
Gopalakrishnan Range Index, developed by Jayanthi Gopalakrishnan, attempts to determine the variability of price data based on the log of the price range over a user defined n-periods.
Configuration Options
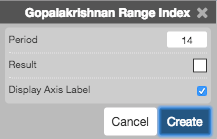
- Period: Number of bars to use in the calculations.
- Color Selectors: Colors to use for graph elements.
- Display Axis Label: Whether to display the most recent value on the Y axis.
Formula
\[GRI = \frac{log(HighestHigh_{n-periods} - LowestLow_{n-periods})}{log(n-periods)}\]