Charts
Elder Ray Index
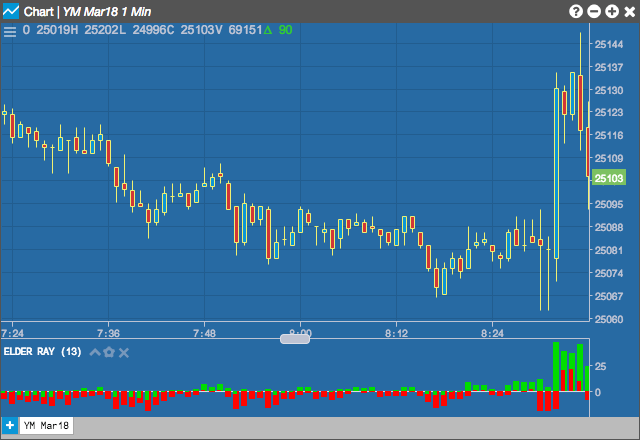
The Elder Ray indicator measures buying and selling pressures to determine which group is driving the market. Bull Power measures whether the high is above or below an exponential moving average; while Bear Power measures whether the low is above or below an estimated moving average.
Configuration Options
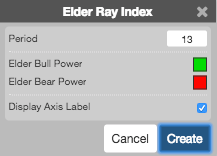
- Period: Number of bars to use in the calculations.
- Color Selectors: Colors to use for graph elements.
- Display Axis Label: Whether to display the most recent value on the Y axis.
Formula
\[Bull\;Power = High - EMA_{n-period}\]
\[Bear\;Power = Low - EMA_{n-period}\]